Article Text

Abstract
Objectives The reciprocal links between comorbidities and gout are complex. We used cluster analysis to attempt to identify different phenotypes on the basis of comorbidities in a large cohort of patients with gout.
Methods This was a cross-sectional multicentre study of 2763 gout patients conducted from November 2010 to May 2011. Cluster analysis was conducted separately for variables and for observations in patients, measuring proximity between variables and identifying homogeneous subgroups of patients. Variables used in both analyses were hypertension, obesity, diabetes, dyslipidaemia, heart failure, coronary heart disease, renal failure, liver disorders and cancer.
Results Comorbidities were common in this large cohort of patients with gout. Abdominal obesity, hypertension, metabolic syndrome and dyslipidaemia increased with gout duration, even after adjustment for age and sex. Five clusters (C1–C5) were found. Cluster C1 (n=332, 12%) consisted of patients with isolated gout and few comorbidities. In C2 (n=483, 17%), all patients were obese, with a high prevalence of hypertension. C3 (n=664, 24%) had the greatest proportion of patients with type 2 diabetes (75%). In C4 (n=782, 28%), almost all patients presented with dyslipidaemia (98%). Finally, C5 (n=502, 18%) consisted of almost all patients with a history of cardiovascular disease and renal failure, with a high rate of patients receiving diuretics.
Conclusions Cluster analysis of comorbidities in gout allowed us to identify five different clinical phenotypes, which may reflect different pathophysiological processes in gout.
- Gout
- Cardiovascular Disease
- Epidemiology
Statistics from Altmetric.com
Introduction
Gout is a common arthritic condition caused by deposition of monosodium urate crystals in joints after longstanding hyperuricaemia. Urate concentrations vary greatly among patients, and the level in a given patient is thought to result from a combination of genetic predisposition, environmental factors and presence or not of comorbidities.1 ,2
Patients with gout often have comorbid conditions such as cardiovascular disease, renal failure and components of the metabolic syndrome.3 Recent data from a large sample of men and women in the USA showed that 74% of gouty patients had hypertension, 71% chronic kidney disease ≥ stage 2, 53% obesity, 26% diabetes and 11% heart failure.4 In addition to high levels of uricaemia and the chronic inflammation encountered in severe gout,5 the presence of these comorbidities contributes to the overall excessive cardiovascular mortality and morbidity due to myocardial infarction and peripheral arterial disease.6–8
The links between these myriad comorbidities and gout are complex. Indeed, some of the comorbidities, such as renal failure and insulin resistance, can increase blood urate levels and thus contribute to the development of gout, whereas hyperuricaemia per se might contribute to the development of hypertension, the metabolic syndrome and renal failure.9 ,10 These complex interactions might generate a vicious circle whereby some comorbidities could become both a cause and an effect of elevated urate levels.
Until now, the approach used to study these interactions was mainly to quantify the risk of incident gout in patients by controlling for each of the comorbidities. However, no attempt has been made to describe how comorbidities may combine in gout or, more generally, to categorise the population of gouty patients into homogeneous subtypes. Determining how these comorbidities aggregate might help in understanding the complex relationship between comorbidities and gout.
Cluster analysis seeks to organise information so that heterogeneous groups of variables can be classified into relatively homogeneous groups.11 In this work, we undertook a cluster analysis to identify phenotypes of comorbidities in a large sample of patients with gout.
Patients and methods
The CACTUS Study was a non-interventional cross-sectional multicentre study conducted in France by rheumatologists and general practitioners from November 2010 to May 2011. It involved patients more than 18 years old with a diagnosis of gout by the physician in charge.
To ensure the best representativeness of the patient sample, each participating physician was asked to include no more than three patients. All the study data were systematically collected on an individual case report form. Demographics, biometrics, gout history (including tophi and kidney stones) and comorbidities were described by the participating practitioners. Most recent (<1 year) urate levels, fasting glycaemia, lipid values, liver enzyme levels and creatininaemia were collected from the patient's file. Physicians were asked to report past and current urate-lowering therapies as well as dietary advice. They were required to report the history of gout within the previous year (number of acute gout attacks and renal colic) and concomitant treatment (diuretics; angiotensin II receptor antagonists, including losartan; other antihypertensive drugs; lipid-lowering agents, including fenofibrate; oral antidiabetic drugs). In addition, physicians had to perform, for each patient, a clinical examination to record the height, weight and waist circumference and determine the presence or not of tophi. Obesity was defined as body mass index≥30 kg/m². Hypertension was defined as blood pressure≥130/85 mm Hg or current antihypertensive treatment. Coronary heart disease included history of angina pectoris and/or myocardial infarction. Renal failure was defined as glomerular filtration rate <60 mL/min. Excessive alcohol drinking was defined as more than two glasses per day for both genders. Patients were considered beer consumers if they drank at least one glass (alcohol-free or not) of beer per day. The same definition was used for sugar-sweetened soft drinks. Liver disorder was defined by the presence of hepatic steatosis or cirrhosis or abnormal liver enzyme levels (serum alanine aminotransferase activity>30 U/L for men and >19 U/L for women and serum γ-glutamyl transpeptidase activity>51 U/L for men and >33 U/L for women).12 The metabolic syndrome was defined by the International Diabetes Federation criteria, namely abdominal circumference ≥94 cm for men and ≥80 cm for women and at least two of the following criteria: high-density lipoprotein cholesterol <1.03 mmol/L in men and <1.29 mmol/L in women or currently taking lipid-lowering agents; triglyceride level > 1.7 mmol/L or lipid-lowering treatment; fasting glycaemia ≥5.6 mmol/L or type 2 diabetes; and hypertension. Hypertriglyceridaemia was defined as blood triglyceride level>2.5 g/L. Patients receiving lipid-lowering drugs or with blood cholesterol level>2 g/L were considered to have hypercholesterolaemia. Dyslipidaemia was defined by the presence of hypertriglyceridaemia or hypercholesterolaemia. Diabetes was defined as a fasting glycaemia >1.26 g/L or use of antidiabetic drugs.
Statistical analysis
Data are expressed as mean±SD for continuous variables, and number and percentages for categorical variables. To assess the influence of gout duration on comorbidities, patients were divided into five groups: patients with newly diagnosed gout and those with a history of gout divided into four quartiles by date of diagnosis. Continuous variables were compared by Student t test or analysis of variance or covariance (the latter adjusted on age). Categorical variables were compared by χ2 test. Missing data were replaced by a negative value for binary variables and were not replaced for continuous variables.
The clustering process began with the selection of variables. Variables were deliberately limited to comorbidities and cardiovascular risk factors. Data for subjects with complete information for these variables were analysed. The relationship among variables was studied by cluster analysis (VARCLUS procedure). The procedure organises a set of variables into hierarchical clusters, thus examining redundancy among variables. For clustering variables, two analyses were conducted. Globally, the variable clustering procedure started with one cluster and split clusters until all clusters showed one eigenvalue >1. The splitting criterion was the average variance of the variables being clustered. In addition, a factorial analysis with oblique rotation was conducted. Because clusters resulting from factorial analysis may be ‘fuzzy’, a complementary step was added, with clusters built from the correlation matrix created by the factorial analysis. Results are presented in a dendrogram showing variables in each grouping and the distance between groupings. Vertical branches represent the combination of two clusters, and horizontal branches the degree of dissimilarity between combined clusters; long distances of the horizontal segments indicate large differences between the formed clusters.
We also clustered observations in patients. As a measure of distance between two clusters, we used the Ward's minimum variance method, whereby the distance between two clusters is the analysis of variance sum of squares between the two clusters added over all the variables. At each generation, the within-cluster sum of squares is minimised over all partitions obtainable by merging two clusters from the previous generation. The sums of squares are then divided by the total sum of squares to give proportions of variance (squared semipartial correlations). The analysis has not been forced to provide a predefined number of clusters, as the optimal number of clusters was determined by the pseudo T² statistic. Statistical analyses used SAS V.9.1.3.
Results
Population
The study involved 2813 patients, of whom 2763 had sufficiently complete data for the classification process. Patients were recruited by 857 general practitioners and 92 rheumatologists. Characteristics of the sample are in table 1. Patients were mostly male (84%). The mean age was 64±12 years, and women were older than men (71±12 vs 62±11 years, p<0.0001). The mean duration of gout was 5.7±6.4 years. Gout was diagnosed at study entry for 152 patients. Most patients with a history of gout (86%) were receiving urate-lowering therapy. Most did not receive adequate treatment because only 22.3% had a urate level<360 µmol/L.
Characteristics of patients with gout (n=2763)
Prevalence of comorbidities in the study population
Comorbidities in the cohort were common (table 1): obesity (39%), type 2 diabetes (25%), hypercholesterolaemia (72%), hypertriglyceridaemia (40%), hypertension (68%), heart failure (7%), coronary heart disease (10%) and chronic renal failure (9%). Prevalence of hypertension, the metabolic syndrome, heart failure and renal failure was greater in women than men (p<0.0001). In contrast, liver disorders and hypertriglyceridaemia were more common in men than women (p=0.004 and p=0.0001, respectively).
Comorbidities according to gout duration
We then investigated whether the prevalence of comorbidities varied by gout duration after adjustment for age and sex (table 2). BMI slightly increased with gout duration, but significance was at the threshold (p=0.05). Similarly, abdominal obesity increased with gout duration even after adjustment for age and sex (p=0.02). Hypertension was more common in patients with a history of gout of more than 1 year than in those with a shorter history of gout (p<0.0001). Similar results were found for dyslipidaemia (p=0.0009), the metabolic syndrome (p=0.02) and liver disorders (p=0.02). In contrast, duration of gout was not associated with a greater prevalence of diabetes, heart failure, coronary heart disease or renal failure.
Characteristics of patients with gout by disease duration (n=2763)
Clustered variables
To assess associations among variables describing comorbidities, two separate analyses were conducted. The initial unique cluster contained nine variables: hypertension, obesity, type 2 diabetes, hypertriglyceridaemia, hypercholesterolaemia, heart failure, coronary heart disease, renal failure and increased liver enzyme levels. The cluster was divided into four clusters explaining 69.1% of the global variance: CV1, associating hypertriglyceridaemia, hypercholesterolaemia and increased liver enzyme levels; CV2, hypertension, heart failure, coronary heart disease and renal failure; CV3, obesity; CV4, diabetes; the last two variables appeared to be independent (figure 1). Intercluster correlations were weak, never exceeded 0.25 and showed good separability. Factorial analysis revealed three factors (F1, F2, F3) explaining only 48.6% of the global variance. F1 correlated with cardiovascular risk factors and diseases (hypertension, heart failure, coronary heart disease and renal failure); F2 (obesity, type 2 diabetes, and increased liver enzyme levels) was linked with symptoms of insulin resistance; and F3 combined hypertriglyceridaemia and hypercholesterolaemia. Reanalysis of the clustering variables with the results of the correlation matrix resulted in three clusters, which confirmed the results of the factorial analysis except for increased liver enzyme levels, which was related to hypercholesterolaemia and hypertriglyceridaemia instead of signs of insulin resistance.
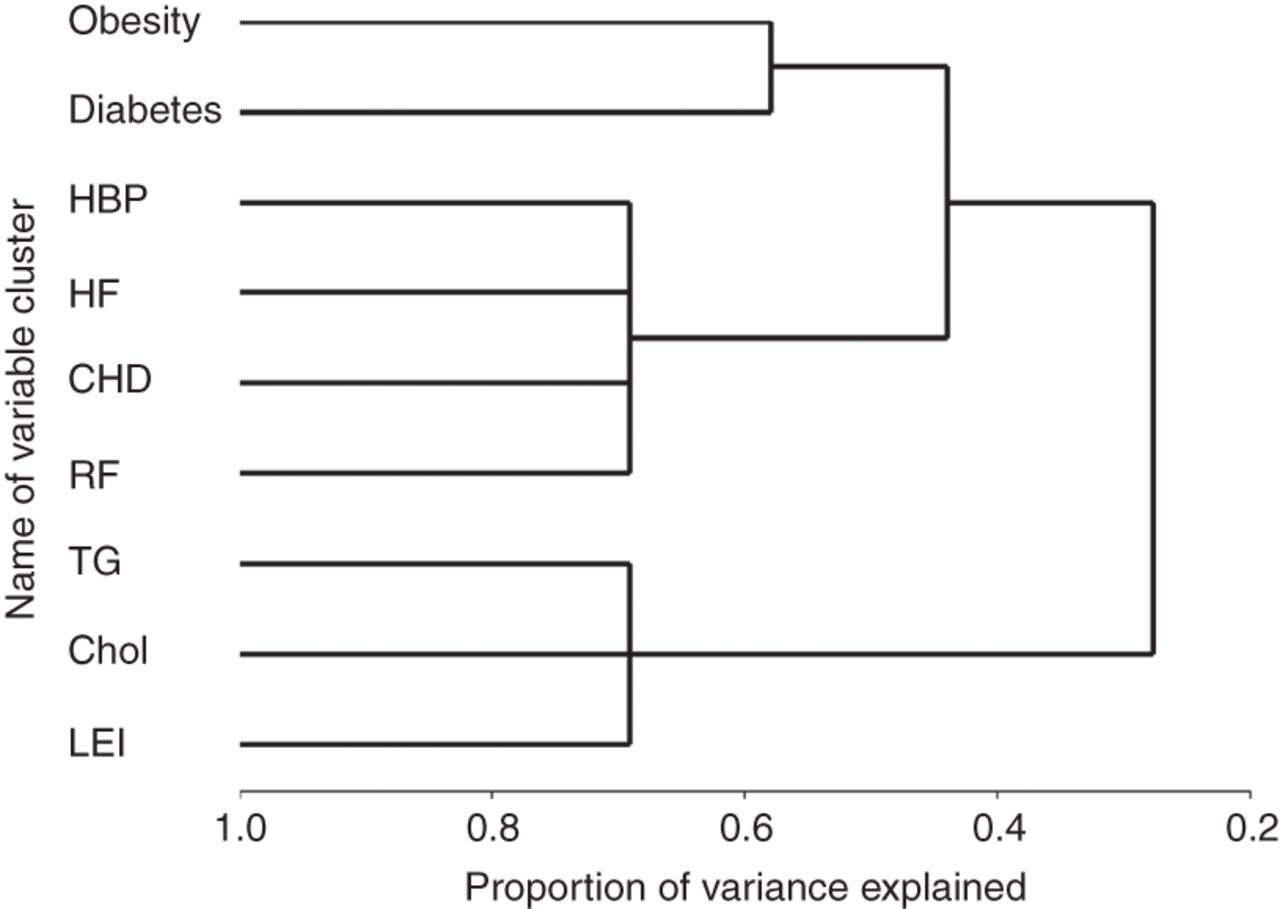
Clustering variables. Dendrogram illustrating the results of the cluster analysis of variables using VARCLUS cluster analysis. If the patterns of response to two variables were similar for most individuals, the variables were grouped, whereas different response patterns suggested that variables were more independent. Each horizontal line represents an individual variable, and the length of horizontal lines represents the degree of similarity between variables. HBP, high blood pressure; HF, heart failure; CHD, coronary heart disease; RF, renal failure; TG, hypertriglyceridaemia; Chol, hypercholesterolaemia; LEI, increase in liver enzyme levels.
Clustering of variables observed in patients
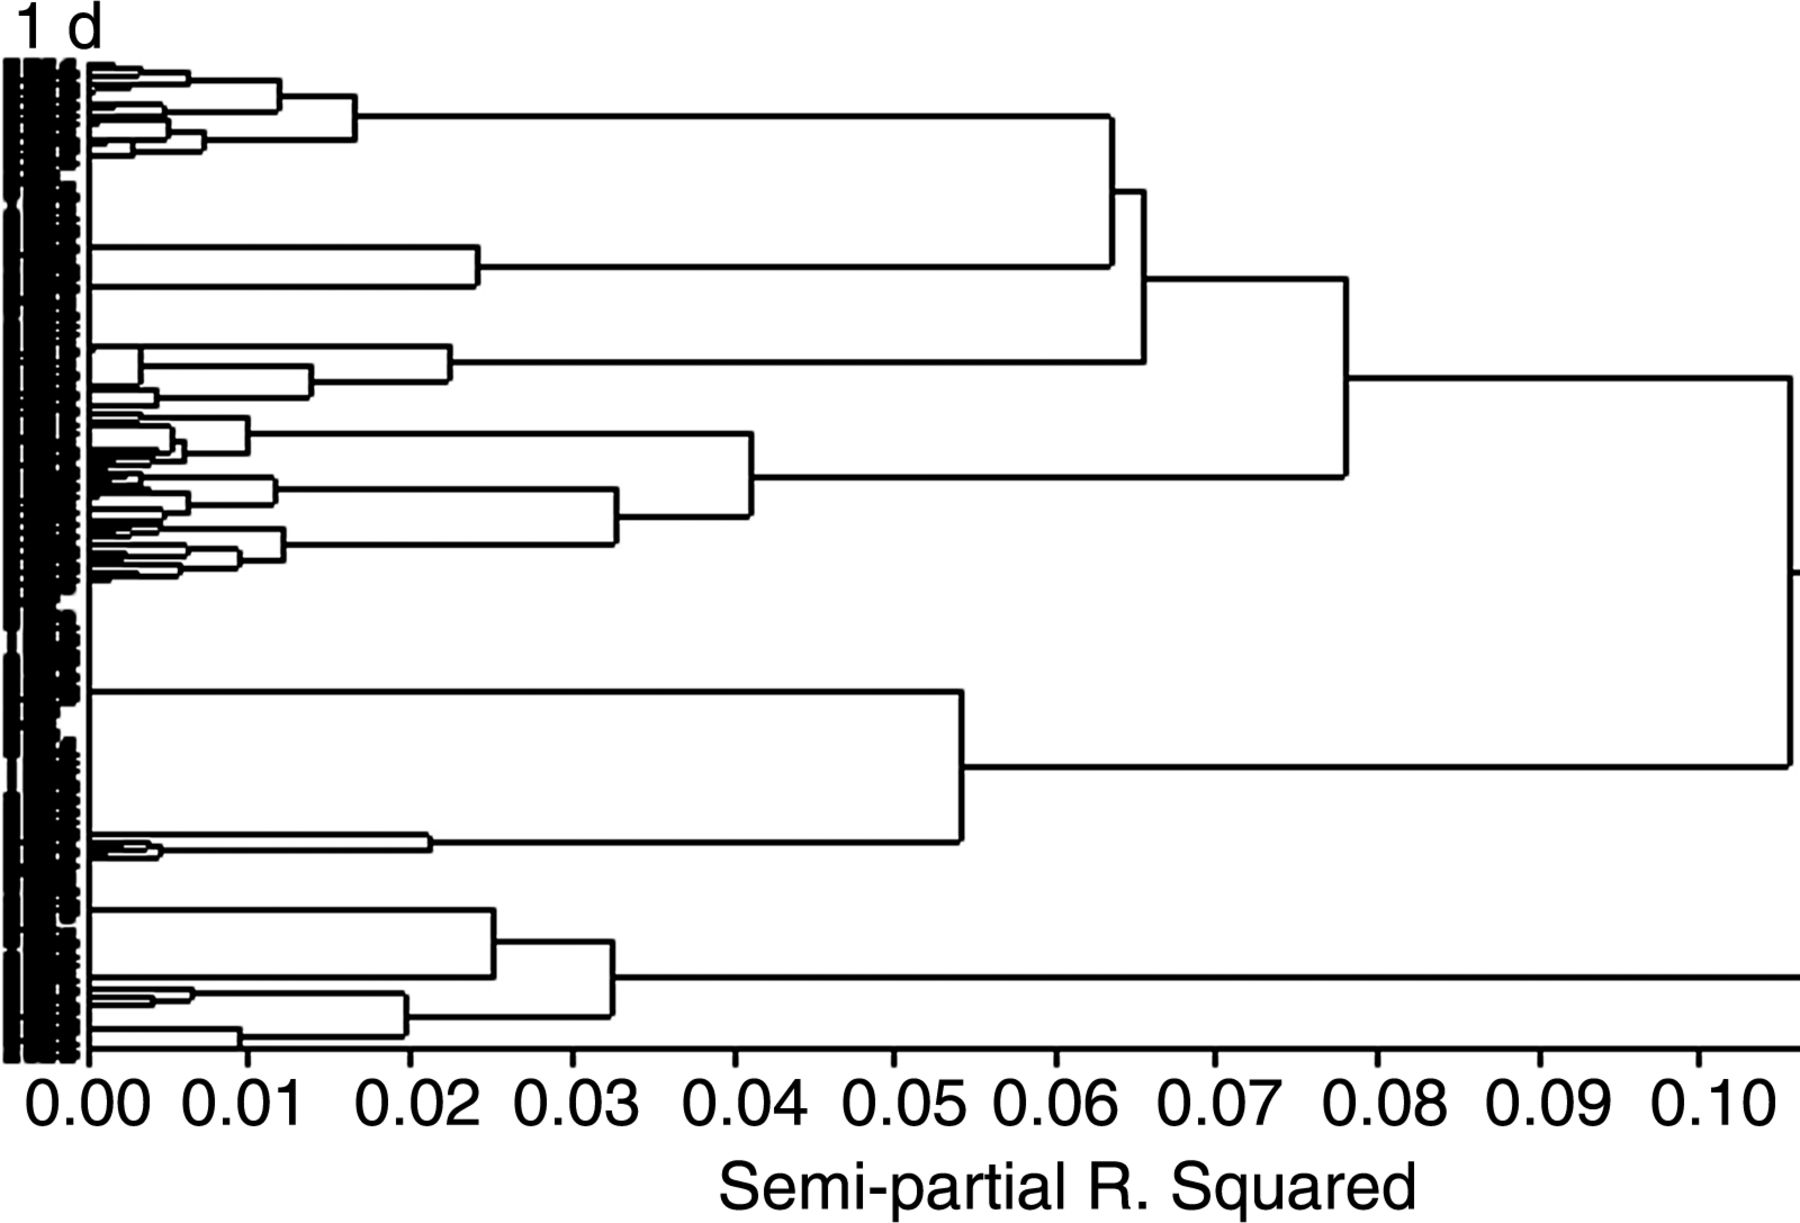
For clustering observations, hypercholesterolaemia and hypertriglyceridaemia were summarised as dyslipidaemia if at least one was present. Other variables were hypertension, obesity, type 2 diabetes, coronary heart disease, heart failure, renal failure and history of cancer. This process resulted in five clusters. The dendrogram is in figure 2, and characteristics of each cluster are in table 3.
Characteristics of patients with gout after clustering on comorbidities
Dendrogram of observations for variables in patients illustrating the results of the cluster analysis of 2763 patients. Each horizontal line represents a patient, and the length of horizontal lines represents the degree of similarity between patients. From left to right, clusters are progressively joined until a single, all-encompassing cluster is formed at the root of the diagram. Clusters exist at each level of the diagram represented by horizontal line segments. Each vertical line segment represents a point where branches are connected into progressively larger clusters. A small horizontal distance between two nodes indicates that the fused clusters were fairly close to each other. Conversely, a large distance suggests that fused clusters were different.
The first cluster (C1, n=332, 12%) combined patients with isolated gout and few comorbidities. No patient had diabetes or dyslipidaemia; none was obese or had cardiovascular disease.
C2 (n=483, 17%) differed from C1 essentially because all patients (100%) were obese. Dyslipidaemia, especially hypercholesterolaemia, was common, as was hypertension (75%, 72% and 64% of patients, respectively). None was diabetic or had cardiovascular disease.
C3 (n=664, 24%) had the greatest proportion of diabetic patients (75%). It accounted for the greater proportion of patients with hypertriglyceridaemia (57%) and liver disorders (39%). Prevalence of dyslipidaemia was high (81%). In contrast, cardiovascular diseases and renal failure were rare (≤2%). Alcohol and beer consumption was more common in this cluster.
In C4 (n=782, 28%), almost all patients had dyslipidaemia (98%), especially hypercholesterolaemia (95%). Almost none had cardiovascular, hepatic or renal disorders.
Conversely, C5 (N=502, 18%) combined almost all patients with coronary heart disease, heart failure and renal failure. About half of the patients were receiving diuretics.
Although age and sex ratio were similar in C1, C2, C3 and C4, patients in C5 were about 10 years older than in other clusters and the cluster contained more women (28%). Interestingly, these patients were not consumers of alcohol or beer, and only 5% drank sugar-sweetened soft drinks.
Discussion
In this large sample of patients with gout recruited from primary care, we first aimed to describe and then characterise their comorbidities using cluster analysis to identify groups of patients similar to each other but different from those in other groups. Cluster analysis revealed five different clinical phenotypes, which may reflect different pathophysiological processes in gout: C1, isolated gout and few comorbidities; C2, obesity, with a high prevalence of hypertension; C3, mostly type 2 diabetes; C4, mostly dyslipidaemia; and C5, mostly history of cardiovascular disease and renal failure, with a high rate of receiving diuretics.
Overall, the prevalence of comorbidities in our sample was similar to that for other previously published cohorts.3 ,5 ,13–16 Notably, the prevalence of hypertension (68%), diabetes (25%) and heart failure (7%) in our patients was close to that found in the NHANES 2007–2008 study4 (74%, 26% and 11%, respectively), with some exceptions, such as obesity (39% vs 53%), probably because of its low prevalence in the general population in France. Of note, the percentage of patients receiving urate-lowering therapy in this study (86%) is close to that found in Germany (84.5%),14 but slightly higher than those found in another French cross-sectional study (67.5%) and in the UK (63%).14 ,17 In addition, the treatment target, urate level<360 µmol/L, was achieved in only 445 patients (22.3%), which confirms that gout is often poorly managed in primary care.18
The number of comorbidities in gout was suggested to be related to disease severity.16 By stratifying for duration of gout, we found that waist circumference, along with prevalence of hypertension, dyslipidaemia and the metabolic syndrome, increased with gout duration, even after adjustment for age and sex. Of note, this finding coincides with an increase in the severity of gout, as defined by an increase in tophi prevalence. Although the cross-sectional design of our study precludes searching for any causal link, these data may suggest that these comorbidities, shown to be risk factors for incident gout,2 could in turn be aggravated by progression of gout when poorly managed, the uricaemia target not being achieved in 77.7% of our patients.
As far as we know, no data have been published on use of clustering to analyse combinations of comorbidities in gout. Among the numerous techniques for clustering observation, we chose hierarchical clustering because it is appropriate for relatively small datasets and does not require assumptions about the number of clusters included in the dataset.19 We identified five subgroups that may reflect different pathophysiological subtypes of gout. Only a small proportion of patients (12%) had ‘isolated’ gout (C1). Of these, 44% showed hypertension, a smaller proportion than for any other cluster. Interestingly, in this cluster, the patients were neither diabetic nor dyslipidaemic, and none was obese or had cardiovascular disease. In addition, the age of patients was similar to that in other clusters (except for C5), which suggests that the absence of comorbidities was related more to a particular phenotype than to the younger age of patients. Genetic factors directly associated with hyperuricaemia may be the main explanation for the occurrence of gout in these patients.
Obesity may be associated per se with hyperuricaemia and gout.20–22 We found a cluster of patients (17%) who were all obese (C2) but did not have diabetes or cardiovascular disease. These patients often had hypertension, dyslipidaemia and abdominal obesity, with 66% having the metabolic syndrome. Insulin resistance may be the common link between these patients. Longitudinal data are lacking to determine whether diabetes will develop in these patients. However, the gout duration was similar to that for patients in C3, with the greatest proportion of patients with type 2 diabetes, which suggests that C2 and C3 represent distinct phenotypes.
C3 patients often had hypercholesterolaemia and hypertriglyceridaemia. The prevalence of the metabolic syndrome in this cluster was the highest among the five clusters. Interestingly, liver disorders were common in these patients, which fits well with recent data showing that elevated urate levels were associated with the development of cirrhosis, increased serum liver enzymes and non-alcoholic fatty liver disease.12 ,23 These data suggest a common mechanism involving the liver, hyperinsulinaemia, insulin resistance, the metabolic syndrome and diabetes. In these patients, combinations of several components of the metabolic syndrome probably favour the onset of gout.
C4 consisted of patients with the highest prevalence of hypercholesterolaemia and also a high prevalence of hypertriglyceridaemia. These patients are of interest because only 2% were obese and 48% exhibited the metabolic syndrome. An increase in circulating fatty acids, demonstrated to be a second signal triggering acute attacks,24 may play a role in this phenotype.
The last cluster (C5) best illustrated the relationship between gout, cardiovascular and renal conditions and diuretics use. These patients accounted for one-fifth of the population and had some specific features. They had less family history of gout than patients from other clusters; gout was diagnosed at a more advanced age, and they were older than other patients at entry in the study. This cluster contained more women than did the other clusters. Gout in women is well known to be associated with comorbidities, mainly hypertension, heart failure and renal insufficiency.25 Importantly, 93% of the patients in the cluster were hypertensive, a higher rate than in other clusters. These patients had no liver disorders, and one-third had diabetes. Overall, C5 contained almost all patients with a history of cardiovascular complications and renal failure. It also included the highest proportion of diuretic users (54%). Thus it probably represents most of the cases of secondary gout.
Our study has several strengths and limitations. Among the strengths, the statistical approach and the large size allowed searches for strong associations among clinical characteristics, thus allowing five different phenotypes to be distinguished. However, neither physicians nor patients were randomly selected. Therefore, the patients cannot be considered to be a nationally representative sample of gout patients. However, each physician was asked to include no more than three patients, and the included patients had to be seen consecutively in order to minimise selection bias. In addition, both general practitioners and rheumatologists participated in the study, and the patients they included could differ in terms of comorbidities. Also, the diagnosis of gout was not based on crystal findings, but rather was reported by the physician, which might have led to a misclassification bias. Finally, we cannot exclude a slight ascertainment bias for the prevalence of some comorbidities, in particular liver disorders and hypercholesterolaemia, partly as a result of the definitions we used for these variables,
In conclusion, aggregation of comorbidities in gout are quite complex. Cluster analysis of these comorbidities allowed us to identify five different clinical phenotypes, which may reflect different pathophysiological processes linked to this disease.
Acknowledgments
We thank all the investigators who collected data for this study. We also thank the patients who agreed to be recruited for the study.
References
Footnotes
Handling editor Tore K Kvien
R-MF and TB contributed equally to this work.
Contributors PR designed the study, was involved in analysis and interpretation of data, and wrote the paper. PC performed the statistical analysis and was involved in the writing of the manuscript. LP and R-MF were involved in the conception of the cohort. TB revised the manuscript critically.
Funding This work was funded by Ménarini and the Association Rhumatisme et Travail (Rheumatology Department, Lariboisière Hospital, Paris, France).
Competing interests None.
Ethics approval This study was approved by the French Departmental Directorate of Health and Social Affairs and the CNIL (Commission nationale de l'Informatique et des Libertés), the French Data Protection Authority. It was conducted in accordance with the Declaration of Helsinki and the Guidance for Good Clinical Practice.
Provenance and peer review Not commissioned; externally peer reviewed.