Article Text

Abstract
Objectives To analyse the long-term relationship between disease activity and radiographic damage in the spine in patients with ankylosing spondylitis (AS).
Methods Patients from the Outcome in AS International Study (OASIS) were followed up for 12 years, with 2-yearly clinical and radiographic assessments. Two readers independently scored the X-rays according to the modified Stoke Ankylosing Spondylitis Spine Score (mSASSS). Disease activity measures include the Bath AS Disease Activity Index (BASDAI), AS Disease Activity Index (ASDAS)-C-reactive protein (CRP), CRP, erythrocyte sedimentation rate (ESR), patient’s global assessment and spinal pain. The relationship between disease activity measures and radiographic damage was investigated using longitudinal, autoregressive models with 2-year time lags.
Results 184 patients were included (70% males, 83% HLA-B27 positive, mean (SD) age 43 (12) years, 20 (12) years symptom duration). Disease activity measures were significantly longitudinally associated with radiographic progression. Neither medication nor the presence of extra-articular manifestations confounded this relationship. The models with ASDAS as disease activity measure fitted the data better than models with BASDAI, CRP or BASDAI+CRP. An increase of one ASDAS unit led to an increase of 0.72 mSASSS units/2 years. A ‘very high disease activity state’ (ie, ASDAS >3.5) compared with ‘inactive disease’ (ie, ASDAS <1.3) resulted in an additional 2-year progression of 2.31 mSASSS units. The effect of ASDAS on mSASSS was higher in males versus females (0.98 vs −0.06 mSASSS units per ASDAS unit) and in patients with <18 years vs ≥18 years symptom duration (0.84 vs 0.16 mSASSS units per ASDAS unit).
Conclusions This is the first study showing that disease activity contributes longitudinally to radiographic progression in the spine in AS. This effect is more pronounced in men and in the earlier phases of the disease.
- Spondyloarthritis
- Ankylosing Spondylitis
- Disease Activity
- Outcomes research
Statistics from Altmetric.com
Introduction
The relationship between inflammation and new bone formation in ankylosing spondylitis (AS) has been extensively debated over the past couple of years.1 ,2 Studies with tumour necrosis factor inhibitors (TNFi), which have profound effects on disease activity in AS, have failed to document inhibition of radiographic damage progression, thus challenging the dogma in rheumatology that inflammation causes damage.3–5
Existing data are inconclusive: In several observational studies up to 4 years duration, the acute phase reactants (APR) C-reactive protein (CRP) and erythrocyte sedimentation rate (ESR) have found to be somehow associated with radiographic progression in AS,6–9 but the patient-reported outcome (PRO) Bath AS Disease Activity Index (BASDAI)) has not.6 ,7
These studies, either positive or negative, have been cross-sectional in nature, implying that they at best provide evidence for a generic association between disease activity and radiographic progression at the group level. Only a true longitudinal analysis, however, will provide insight into whether an increase in disease activity in a patient will be followed by an increase in radiographic progression in that patient.
Several reasons may explain why associations between disease activity and radiographic progression are not easily demonstrated: First, radiographic progression in AS is slow and is difficult to measure. Patients have to be followed up for a long period to detect sufficient progression of damage, while measurement error often jeopardises a reliable progression signal. Second, thus far disease activity in these analyses has either been measured with PROs (eg, BASDAI) or with APR (eg, CRP), providing disparate results. The recently developed AS Disease Activity Index (ASDAS) combines PROs and APR and has demonstrably better psychometric properties than the BASDAI and the CRP.10 ,11 ASDAS is therefore an attractive measure for disease activity in sophisticated longitudinal analyses. Third, associations of interest have usually been applied in databases of modest patient numbers and short follow-up duration, while usually only baseline and endpoint radiographic scores were exploited, making conventional analyses less robust. A cohort with AS patients with long-term follow-up and multiple repeated outcome observations will allow a true longitudinal analysis and provide more statistical power, thus creating more robust results.
In the past, we have been able to demonstrate a true longitudinal relationship between disease activity and radiographic progression in rheumatoid arthritis.12 Using a similar methodology, we here present a true longitudinal analysis in a 12-year follow-up cohort of patients with AS. The aim was to investigate the longitudinal relationship between disease activity measured by various assessments and radiographic progression in patients with AS.
Methods
Study population
For this study, data from the Outcome in Ankylosing Spondylitis International Study (OASIS) were used. OASIS is a prevalence cohort including 217 consecutive patients with AS from the Netherlands, Belgium and France, which was started in 1996.13 Clinical and radiographic (cervical and lumbar spine) data were collected every 2 years during 12 years. Patients were included in the present study if they had at least two sets of radiographs and data on disease activity available. All patients have given informed consent, and the ethics committees from all participating hospitals have approved the study.
Radiographic damage
Radiographs were scored using the modified Stoke Ankylosing Spondylitis Spine Score (mSASSS).14 According to this method, the anterior vertebral corners (VCs) of the cervical and lumbar segments (total of 24 VCs) are scored on a lateral view only for the presence of an erosion and/or sclerosis and/or squaring (one point), syndesmophyte (two points) and bridging syndesmophyte (three points). The total score ranges from 0 to 72.14
Two well-trained readers (SR and CS) have independently scored all available radiographs per patient, blinded to demographic and clinical data, but with known chronology, as this is the most sensitive method.15 Average scores of the two readers were used. A total of 809 radiographs (184 at baseline; 177 at year 2; 126 at year 4; 106 at year 6; 66 at year 8; 82 at year 10; and 68 at year 12) were obtained in which the mSASSS could be determined. Details of the radiograph readings, imputation of missing VCs and reliability have been reported elsewhere.16
Disease activity
Disease activity measures include the BASDAI (0–10),17 the ASDAS (which was calculated using the CRP (mg/L)),11 CRP, ESR, patient’s global assessment of disease activity (0–10) and spinal pain (0–10). Disease activity states were computed using the ASDAS cutoff-levels18: inactive disease (ASDAS <1.3), moderate disease activity (1.3 ≤ASDAS <2.1), high disease activity (2.1 ≤ASDAS ≤3.5) and very high disease activity (ASDAS >3.5). In analogy, disease activity states based on BASDAI were computed, and because there are no well-defined cut-offs, we chose the following: BASDAI <2, 2 ≤BASDAI <4, 4 ≤BASDAI ≤6 and BASDAI >6.
Other potentially contributing factors
Factors potentially influencing the relationship between disease activity and radiographic damage were also taken into account. These included symptom duration, gender, HLA-B27 status, baseline mSASSS, extra-articular manifestations (EAM) and treatment. Information on the presence of EAM, that is, uveitis, psoriasis or inflammatory bowel disease, was collected at every visit, and each EAM was considered to be persistent after its first presentation. Non-steroidal anti-inflammatory drugs (NSAIDs), disease-modifying antirheumatic drugs (DMARDs) and/or TNFi were recorded as dichotomous variables (yes/no) at every visit. NSAID intake was also computed, for every 2-year interval, according to the NSAID index proposed by the Assessment of SpondyloArthritis international Society (ASAS),19 which takes into account the type of drug, dose and duration of treatment, varying from 0 to 100 (100 means daily NSAID intake in full dose).
Modelling and statistical analysis
The relationship between disease activity measures and radiographic damage was investigated using generalised estimating equations (GEE), which is suitable to elucidate longitudinal relationships, and makes use of all available data.20 ,21 GEE corrects for the within-subject correlation, and for this it requires an a priori defined ‘working’ correlation structure. On the basis of the covariance matrix, the ‘exchangeable’ correlation structure was most appropriate because the correlations of the outcome at different time points were approximately equal (Pearson correlation coefficients between 0.80 and 0.99).
In a first set of analyses (baseline analysis), we have investigated using GEE whether disease activity determined at baseline was associated with the development of radiographic damage over time (disease activity × time interaction).
In a second set of analyses (longitudinal analysis), the longitudinal relationship between disease activity measures and mSASSS over time was analysed in autoregressive marginal models with 2-year time lags using GEE. Autoregressive analysis adjusts a variable's absolute value at a particular time point (t) (here: mSASSSt) for the variable's absolute value at the previous time point (t−1) (here: mSASSSt−1) and can be considered synonymous to modelling progression over time. A ‘2-year time lag’ here means that a disease activity measure at the start of a 2-year interval (eg, ASDASt) was related to radiographic progression during the consecutive 2-year interval (here: mSASSSt was modelled by ASDASt−1 and by mSASSSt−1). Interactions were tested and if proven significant (here p<0.1), analyses were repeated in subgroups.
The following longitudinal models that differed with regard to the disease activity measure were run: (1) with ASDAS as a continuous measure; (2) with ASDAS categories; (3) with BASDAI as a continuous measure and CRP; (4) with BASDAI categories and CRP; (5) with patient global as a continuous measure and CRP; and (6) with spinal pain as a continuous measure and CRP.
The main model included only variables that were either (1) associated with mSASSS or (2) confounded the relationship between disease activity and radiographic progression.
A sensitivity analysis was performed including all variables that, from a clinical perspective, could be contributory to explaining the relationship between ASDAS and mSASSS.
Goodness-of-fit statistics (quasi-likelihood under the independence model criterion (QIC)) were used to get an impression about ‘how good the model fits the data’, with lower QICs reflecting better data fit.
Analyses were done using Stata SE V.12 (Statacorp, College Station, Texas, USA).
Results
In total, 184 patients (70% males, 83% HLA-B27-positive) with at least one 2-year mSASSS interval and disease activity measures at the start of that interval available were included in the analyses (table 1). These patients had similar baseline characteristics as those included in the entire OASIS cohort (see online supplementary table S1). Patients that were followed-up until year 12 were not different from those initially included in the study (see online supplementary table S1).
Baseline demographic, clinical and radiographic characteristics
A total of 39 (21%) patients had 2 sets of X-rays, 32 (17%) had 3 sets, 31 (17%) had 4 sets of X-rays, 32 (17%) had 5 sets, 29 (16%) had 6 sets and 21 (11%) had all 7 sets of X-rays.
During follow-up, 95% of the patients were at some time exposed to NSAIDs and 22% (5% before year 8) to TNFi. The mean (SD) follow-up duration per patient was 7.9 (4.0) years, and the mean (SD) number of radiographs was 4.2 (1.7) (range 2–7). The vast majority (87%) of the intervals between evaluable x-rays were 2 years, in less than 1% was the interval longer than 6 years and on average the interval was 2.4 years.
Baseline analysis
On average patients had a progression of 1.9 mSASSS units/2 years. All separate disease activity measures assessed at baseline except spinal pain were significantly associated with the course of radiographic damage over time (table 2).
Effect of disease activity at baseline on the course of radiographic progression over time
Patients with inactive disease (ASDAS <1.3) at baseline had an average progression of 0.71 mSASSS units/2-years, whereas patients with very high disease activity (ASDAS >3.5) at baseline had a progression of 3.1 mSASSS units/2-year progression. A similar relationship was found for BASDAI: patients with a BASDAI <4 at baseline had an average progression of 1.4 mSASSS units/2 years, while patients with a BASDAI ≥4 (2.7 mSASSS units/2 years) or those with a BASDAI >6 (2.0 mSASSS units/2 years) at baseline experienced more progression over time.
Longitudinal analysis
All disease activity measures, except ESR as a separate variable, were longitudinally associated with radiographic progression (table 3). The autoregressive time-lagged nature of the analysis is congruent with the following longitudinal interpretation: “An increase of one ASDAS unit in an individual patient is expected to lead to an increase of 0.72 mSASSS units over the next two years”.
Longitudinal relationship between disease activity and radiographic damage
Further, “a patient with very high disease activity (ASDAS >3.5) may in comparison to a patient with inactive disease (ASDAS <1.3) expect an additional progression of 2.3 mSASSS-units in the subsequent two years.”
Similarly, “an increase of one BASDAI unit is associated with an increase of 0.21 mSASSS units, and an increase of 10 mg/L in CRP is associated with an increase of 0.2 mSASSS units”.
Models with ESR instead of CRP were similar, except for the fact that ESR itself was not a statistically significant contributor in any analysis.
The model with ASDAS as a continuous score had lowest QICs of all models, illustrating that the model with ASDAS as a disease activity measure has best captured variation in radiographic scores (better than the model with BASDAI and CRP, for instance).
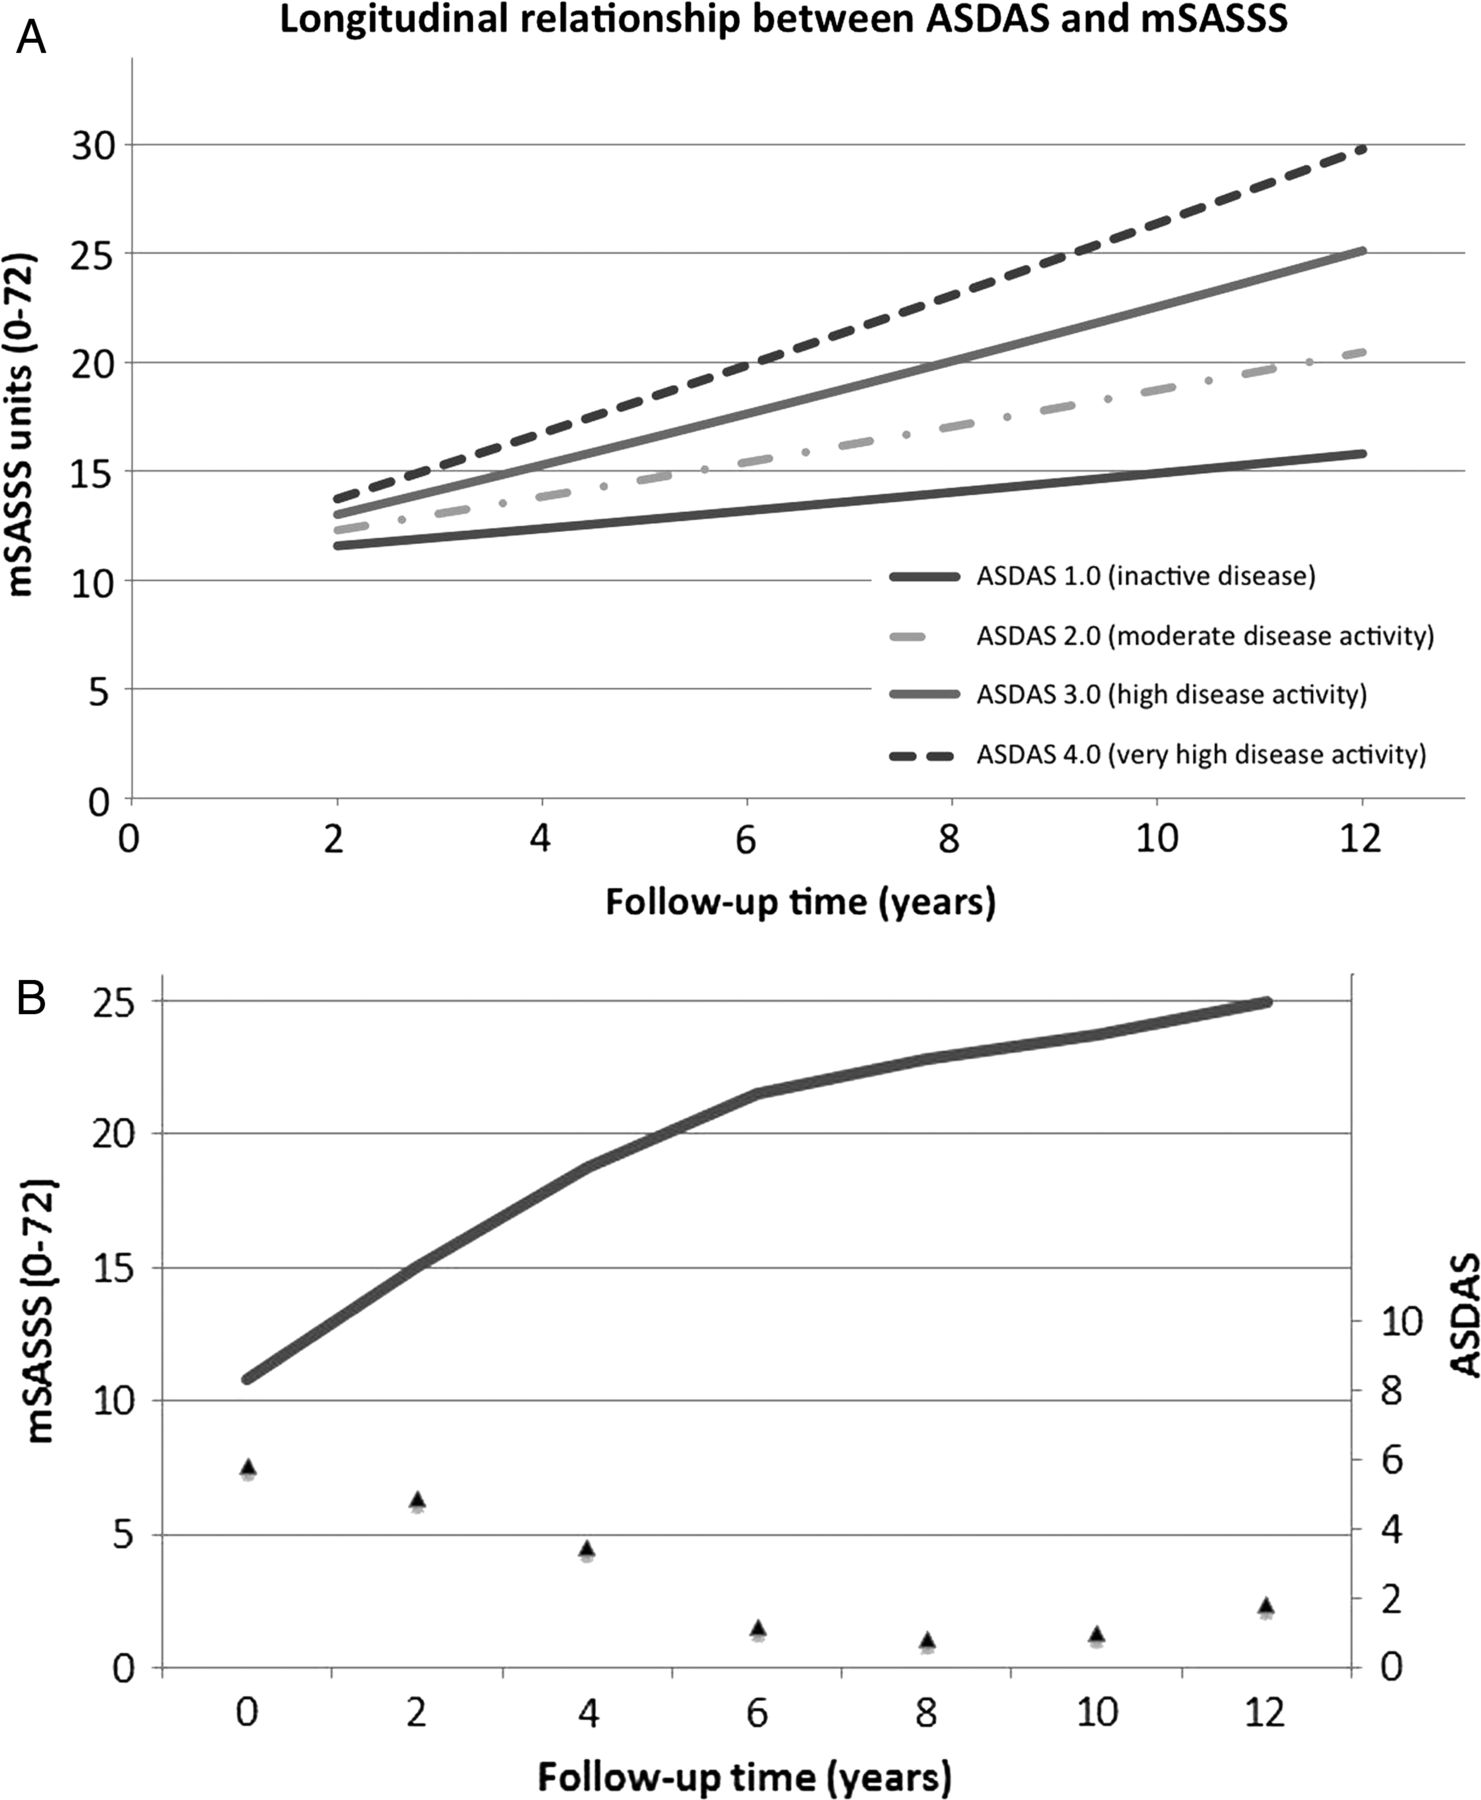
The visual relationship between ASDAS and mSASSS is shown in figure 1. In this modelling exercise, figure 1A, a stable ASDAS level over time was assumed, and progression curves were plotted for different ASDAS levels. Starting with an mSASSS of 10.8 at baseline (representing the study population’s mean value), the average patient with ‘inactive disease’ (plotted as ASDAS of 1.0) would reach an mSASSS of 15.8 (5 units progression) after 12 years, whereas the average patient with ‘very active disease’ (plotted as ASDAS of 4.0) would reach an mSASSS of 29.8 units (19 units progression). In figure 1B, a modelled example is shown reflecting how (longitudinal) fluctuation in ASDAS may lead to (longitudinal) fluctuation in mSASSS progression in a typical patient.
Longitudinal relationship (modelled) between disease activity (ASDAS) and radiographic damage (mSASSS). The graphs are two visualisations (solutions) of the same multivariable regression equation with the parameter estimates shown in table 4: mSASSStime point t=−0.27+1.03 *mSASSSt−1+0.72 ASDASt−1. The mSASSS at baseline (10.8 units) was assumed to be the intercept (mSASSS at t0). In (A), four equidistant ASDAS values, each reflecting a certain disease activity state, were chosen and a stable ASDAS level over time was assumed. In (B), fluctuating ASDAS levels over time (in a decreasing pattern) were assumed (closed triangles). ASDAS, Ankylosing Spondylitis Disease Activity Score; mSASSS, modified Stoke Ankylosing Spondylitis Spine Score.
A significant interaction was found between ASDAS and gender (p=0.007), as well as ASDAS and symptom duration (p=0.011). The effect of ASDAS on mSASSS was higher in males versus females: an increase of one ASDAS unit led to an increase of 0.98 and −0.06 mSASSS units/2 years, respectively. The effect of ASDAS on mSASSS was also higher in patients with symptom duration below the median (18 years) versus above the median: an increase of one ASDAS unit led to an increase of 0.84 vs 0.16 mSASSS units/2 years, respectively (table 4).
Longitudinal relationship between ASDAS and radiographic damage in different strata
The same type of effect modification was found in the models with other disease activity measures. Effect modification or confounding was not found for HLA-B27, drug use (NSAIDs, TNFi) and the presence of any EAM (table 3). Additional information on drug use over time can be found in the online supplementary table S2. A sensitivity analysis including HLA-B27, NSAID-score and TNFi-usage provided similar results as the main analysis (see online supplementary table S3).
When—as a sensitivity analysis—analyses were repeated using only data from follow-up until year 4, results were similar for most disease activity measures, but the longitudinal association between CRP and radiographic progression was not statistically significant anymore.
Discussion
In the present study, we have shown for the first time that disease activity is longitudinally associated with radiographic progression in AS. The effect of disease activity on radiographic damage is stronger in men than in women, and in the earlier phases of the disease. Although the longitudinal association is seen with all measures of disease activity, the ASDAS, combining PROs and APR in a fixed relationship, showed the best performance.
Previous studies have found only a relatively weak association between radiographic progression and APR, but not with radiographic progression and PROs such as BASDAI.6–9 Further, these studies provided cross-sectional analyses that do not allow a longitudinal interpretation.6 ,7 We have demonstrated here for the first time that the effect of disease activity on radiographic damage is actually rather impressive and longitudinal: per one ASDAS unit increase a 0.7 mSASSS units progression in 2 years can be expected. This longitudinal relationship was pertinent over the entire 12 years of follow-up. An important observation here is that the models with ASDAS as a disease activity measure outperformed the models with all other disease activity measures, which importantly adds to the validity of ASDAS as the disease activity measure of choice. The fact that significant longitudinal associations with radiographic progression could also be established for other disease activity measures (among which PROs that showed inconclusive results in conventional cross-sectional analyses in the past) than ASDAS alone points to the power of longitudinal databases and appropriate longitudinal analysis.
While the observation of a link between disease activity and radiographic progression is rather new, we acknowledge that disease activity (inflammation) by far does not fully explain radiographic damage in AS: even without measurable disease activity there is still considerable radiographic progression. It can be deduced from the model that patients who have inactive disease for the entire 12 years still can expect a progression of 5 mSASSS units on average. Radiographic progression without measurable clinical disease activity in AS is different from radiographic progression in patients with RA in remission in which progression is almost absent. It seems as if increased bone formation in AS is partly constitutive and partly inflammation-dependent. A parallel with findings from MRI studies is appealing here: MRI inflammation at the vertebral corner to some extent forecasts the development of syndesmophytes, but most new syndesmophytes still develop in sites not previously active on MRI.22
The effect of disease activity on radiographic progression seems to be far stronger in men than in women. Only in men we found an additional progression of about 1 mSASSS unit per 2-year interval per additional unit of ASDAS. This male–female disparity is an attractive explanation for the frequently observed more severe radiographic damage in males.16 Such a statement should be taken with some consideration, though, since less than one-third of the included patients were women with on average little structural progression, which complicates the search for an external factor that modulates progression.16
We have also found a stronger effect of disease activity on radiographic progression in the (relatively) early phase of the disease. A clear explanation is lacking, but one might speculate on the effects of more strenuous physical exercise in the early phases of the disease as compared with the later phases. A relationship between mechanical forces on the spine and syndesmophyte formation has been postulated in the past,23 and one may reason that younger people with shorter disease duration will usually perform more intensive occupational physical activities with stronger forces acting on the spine. Since male patients may often have physically more demanding jobs than females, this speculative explanation may extend to the demonstrated male–female disparity. Of note, short and long symptom duration in our analysis is only a convenience distinction since we have stratified by the median of symptom duration, which was already 18 years. It is obvious that more research should give resolution here.
What are the consequences of our observations?
It was the unexpected lack of inhibition of structural damage by TNFi3–5 that has triggered the debate about the link of inflammation and bone formation. Recent new observational studies have suggested a protective effect of TNFi on radiographic progression,9 ,24 but are not beyond methodological argumentation.25
The results of the current study could light-heartedly be interpreted as if inhibition of disease activity (by, eg, TNFi) will automatically lead to inhibition of radiographic progression. Such a spurious ‘causal-chain-interpretation’ would ignore the evidence that TNFi have more effects than only suppression of TNF-induced inflammation. For example, TNFi have been suggested to be responsible for bone formation in animal models,26 so that negative effects on unrelated bone-forming processes could counterbalance a potentially positive effect on inflammation. The negative results of TNFi with regard to syndesmophyte formation in three independent studies with an untreated control group3–5 are compatible with such a scenario and cannot easily be ignored by sparse information from observational studies,9 ,24 although former trials were of short duration.
Further, trials with NSAIDs in AS in fact have proven a TNF-independent mechanism of action being responsible for NSAID-induced inhibition of syndesmophyte formation.27
The biggest challenge for the near future will therefore be to design a clinical study that takes all these different aspects into consideration.
This study has limitations that should be discussed. As a cohort study, it suffers from losses to follow-up, which may result in bias-by-completion. However, our main study question relates to an association between disease activity and radiological progression rather than to find the best estimate of absolute progression. It is unlikely that the relationship between disease activity and progression per se is different in patients completing 12 years of follow-up and in those that discontinue early for whatever reasons. Furthermore, the sample size of this long-term observational study is not large enough to split the data into several relevant subgroups (eg, females only, or HLA-B27-negative patients).
Strengths of our study are the uniquely long follow-up of patients with AS according to a predefined protocol of data collection and the longitudinal analyses we conducted, which make use of all data collected over time, are more powerful and may to some extent allow a temporal relationship, thus bringing in an element of causality. Analyses incorporated adjustments for existing structural damage at every time point, the strongest known determinant of subsequent progression.6 ,7 ,28 Another important strength of this study, already discussed, is the consistency of the results across the different disease activity measures analysed in this study.
In summary, this study has demonstrated that inflammation in AS indeed leads to new bone formation. The next question will be whether lowering disease activity by drugs with various modes of action will result into less radiographic damage.
References
Supplementary materials
Supplementary Data
This web only file has been produced by the BMJ Publishing Group from an electronic file supplied by the author(s) and has not been edited for content.
Files in this Data Supplement:
- Data supplement 1 - Online appendices
Footnotes
-
Handling editor Tore K Kvien
-
Contributors SR, AvT, RL and DvdH designed the study. SR, AvT, CS, RL, FvdB, MD and DvdH collected the data. SR and CS read the radiographs. AvT was the adjudicator. SR, AvT, RL and DvdH analysed the data and critically interpreted the results. SR prepared the first version of the manuscript. All the authors reviewed the draft versions and gave their approval of the final version of the manuscript.
-
Competing interests SR was supported by the Fundação para a Ciência e Tecnologia (FCT) grant SFRH/BD/68684/2010.
-
Patient consent Obtained.
-
Ethics approval The ethics committee from all participating hospitals have approved the study.
-
Provenance and peer review Not commissioned; externally peer reviewed.