Article Text

Abstract
Objectives Weight loss leads to reduced serum urate (SU) in people with obesity. However, the clinical relevance of such reductions in SU is unknown. This study examined the impact of non-surgical weight loss and bariatric surgery on SU targets in people with morbid obesity and diabetes.
Methods The study was a single-centre, prospective study of 60 people with type 2 diabetes and body mass index ≥35 kg/m2. Following 6 months of non-surgical weight loss, all participants had laparoscopic sleeve gastrectomy, with a further 1 year of follow-up. Serial SUs were measured throughout the study.
Results Participants experienced mean (SD) weight loss of 5.5 (4.1) kg prior to surgery and 34.3 (11.1) kg following surgery. SU did not change following non-surgical weight loss (0.38 (0.09) mmol/L at baseline and 0.38 (0.10) mmol/L at follow-up), but increased to 0.44 (0.15) mmol/L in the immediate postoperative period and reduced to 0.30 (0.08) mmol/L 1 year after surgery (p<0.05 for both compared with baseline). Baseline SU, cessation of diuretics, female sex and change in creatinine independently predicted change in SU at the final visit. In participants without gout, SU above saturation levels (≥0.41 mmol/L) were present in 19/48 (40%) at baseline and 1/48 (2%) 1 year after surgery (p<0.0001). In participants with gout, SU above therapeutic target levels (≥0.36 mmol/L) were present in 10/12 (83%) at baseline and 4/12 (33%) 1 year after surgery (p=0.031).
Conclusions Clinically relevant reductions in SU occur following bariatric surgery in people with diabetes and WHO class II or higher obesity.
- Gout
- Epidemiology
- Lipids
Statistics from Altmetric.com
Introduction
Gout is a disorder of monosodium urate (MSU) crystal deposition. MSU crystals form in the presence of tissue concentrations above saturation levels, typically ≥0.41 mmol/L (6.8 mg/dL) at physiological pH and temperature.1 The serum urate (SU) level of ≥0.41 mmol/L is also the concentration above which the risk of developing gout is observed.2 A central strategy for long-term management in patients with gout is reduction of SU to well below saturation concentrations to <0.36 mmol/L (6 mg/dL).3
Gout is strongly associated with obesity and metabolic syndrome. A large prospective study has reported that adiposity and weight gain are important risk factors for developing gout, while weight loss is protective.4 We have reported high prevalence (16–22%) of gout in people with type 2 diabetes.5 ,6 The relationship between gout, diabetes and obesity is mediated, at least in part, by hyperuricaemia; SU correlates strongly with central adiposity,7 and insulin inhibits renal tubular uric acid excretion.8
Bariatric surgical intervention is a safe and effective means of delivering marked weight reduction. Published data have shown significant rates of remission of type 2 diabetes in the order of 80%.9 Bariatric surgery is associated with dramatic improvements in metabolic control in people with morbid obesity and type 2 diabetes, with return to euglycemia, restored insulin sensitivity, and improved lipid profile and blood pressure control.9 ,10
Many studies have demonstrated that weight loss leads to reduced SU in people with obesity.11–13 As with other parameters of the metabolic syndrome, SU also improves following bariatric surgery.14–16 However, the therapeutic consequences of such reductions in SU are less certain. For example, it is unclear whether bariatric surgery can achieve reductions in SU to levels below saturation (<0.41 mmol/L) or to therapeutic levels (<0.36 mmol/L). The aim of this study was to examine the impact of non-surgical and surgical weight loss on SU targets in people with morbid obesity and diabetes.
Methods
The study was a single-centre, prospective study of people with type 2 diabetes and WHO class II or higher obesity (body mass index (BMI) ≥35 kg/m2) undergoing laparoscopic sleeve gastrectomy. All were participating in a Community Chronic Care Management Program for at least 12 months and were enrolled through their general practitioner. Participants were recruited between 10 February 2008 and 23 June 2010. Written informed consent was obtained from participants before the initiation of the study procedures.
Key inclusion criteria were age between 20 years and 60 years, diagnosis of type 2 diabetes mellitus (minimum of 1 year since diagnosis) in accordance with American Diabetes Association criteria,17 treated with oral hypoglycaemic medication or insulin, HbA1c 7–10%, BMI ≥35 kg/m2 prior to the baseline visit, and no contraindications to surgery as determined by multidisciplinary surgery team. Key exclusion criteria were diabetic nephropathy (urine albumin : creatinine ratio >200 mg/mmol), non-diabetic renal disease, serum creatinine >150 μmol/L in men and >130 μmmol/L in women, significant malabsorptive or gastrointestinal disorder, serious comorbid conditions likely to affect survival.
At the baseline visit, all participants were assessed to determine eligibility. If eligible, baseline data were collected and participants received preoperative information session, individual surgical consult, clinical nurse specialist follow-up, dietary consult and set goals to establish a regular exercise programme and lose 5–10 kg in the preoperative 6 months. All participants received specific dietetic advice for weight loss (low fat intake, portion modification) at study entry, and the very low calorie diet Optifast VLCD programme for 4 weeks prior to the proposed surgery date. Participants attending follow-up visits and achieving presurgical weight loss requirements proceeded to bariatric surgery 6 months after the baseline visit. These participants underwent a laparoscopic sleeve gastrectomy at a single centre performed by one of three surgeons.
Clinical variables including medications, weight and laboratory tests were measured at the baseline visit (−6 months), at the preoperative visit (0 months) and in the postoperative period (2 weeks, 1 month, 3 months, 6 months, 9 months and 12 months after surgery). All participants with gout met the American College of Rheumatology (ACR) classification criteria for gout.18 Gout flares were self-reported. SU was measured at each study visit using the Roche Modular P (Hitachi) analyzer. Glomerular filtration rate (GFR) was determined using the Modification of Diet in Renal Disease formula.19
Data were analysed using SPSS (V.20, SPSS, Chicago, Illinois, USA) and SAS (V.9.2, SAS Institute, Cary, North Carolina, USA). Means with SDs and percentages were used to describe the clinical characteristics of participants. Differences between patients with and without gout were analysed using χ2 analysis and t tests. For the primary analysis of the entire group, a mixed models approach to repeated measures (Proc Mixed SAS V.9.2) was used to model continuous normally distributed variables (serum urate, weight, fasting glucose, creatinine and triglycerides) over the main effect of time. Post hoc examination of significant main effect was made using Dunnett's test with −6 months as the baseline. For categorical data, the Bonferroni p value was calculated as the critical 5% significance level divided by the number of comparisons (n=7). Where data were missing for a follow-up visit, the last observed value carried forward approach was taken. For the subgroup analysis (subgroups with and without gout), comparisons were made between baseline and the final study visit (12 months after surgery). Paired changes over time were analysed using Student's t test for continuous data and McNemar’s test for categorical data. Pearson's correlations were use to determine relationships between continuous variables. Stepwise linear regression analysis was used to determine the independent predictors associated with change in SU at the final study visit. To address the non-linear relationship between glucose and HbA1c with serum urate,20 HbA1c and fasting glucose ranges were also included in the regression models. SU cut-points were selected as ≥0.41 mmol/L as the level above saturation of urate at physiological pH and temperature,1 and ≥0.36 mmol/L as the level above therapeutic target.3 All tests were two tailed and p<0.05 was considered statistically significant.
Results
Participants
There were 177 patients referred for consideration for entry to the study. Reasons for not being enrolled in the study were: not being in the Chronic Care Management Program and/or resident in the hospital area (n=23), patient choice (n=27), not meeting all inclusion criteria or excluded due to comorbidity or surgical criteria (n=55). Age, sex and ethnicity were similar in those who met all the entry criteria and consented and those who did not enter the study (data not shown). In total, 72 participants were assessed for inclusion in the study. Eleven participants did not proceed to surgery due to failure to meet presurgery weight loss requirements or attend appointments, and one due to development of fast atrial fibrillation during anaesthetic induction. Therefore, 60 participants were included in the analysis. Three participants were lost to follow-up in the postoperative period (all after the 6 months postoperative study visit).
Clinical features at baseline
The baseline characteristics of the 60 participants are shown in table 1. In the entire group mean (SD) weight was 135.3 (22.1) kg and SU was 0.38 (0.09) mmol/L. There were 24/60 (40%) participants with SU above saturation concentrations (≥0.41 mmol/L) at baseline.
Clinical characteristics of the entire group and those with and without gout at baseline
Twelve (20%) participants had documented gout at the time of enrolment into the study. All met ACR clinical classification criteria for gout, and one had crystal proven disease. Nine (75%) of these participants were taking urate-lowering therapy; one on probenecid monotherapy and eight on allopurinol at a mean (SD) dose of 237 (177) mg/day. Two participants described a gout flare in the 3 months prior to entry into the study. Mean (SD) gout disease duration was 6.4 (7.0) years. Participants with gout had higher serum creatinine and SU above the therapeutic target (≥0.36 mmol/L) (table 1).
Effects of presurgical weight loss in the entire group
In the 6 months prior to the surgical intervention, participants achieved mean (SD) weight loss of 5.5 (4.1) kg with dietary intervention (figure 1A). No significant reductions in fasting glucose, triglyceride, HbA1c, serum creatinine or GFR were observed over this period (figure 1B–F). No change was observed in SU; at baseline, mean (SD) SU measured 0.38 (0.09) mmol/L, and after 6 months of presurgical weight loss, mean SU measured 0.38 (0.10) mmol/L (p=0.99) (figure 2A).

Changes in clinical variables in the entire study group (n=60). (A) Weight. (B) Fasting glucose. (C) HbA1c, (D) Triglycerides, (E) Serum creatinine, (F) Glomerular filtration rate. Data are presented as mean (95% CIs). p Values refer to comparison with baseline (−6 months) values. Dashed line refers to day of surgery.
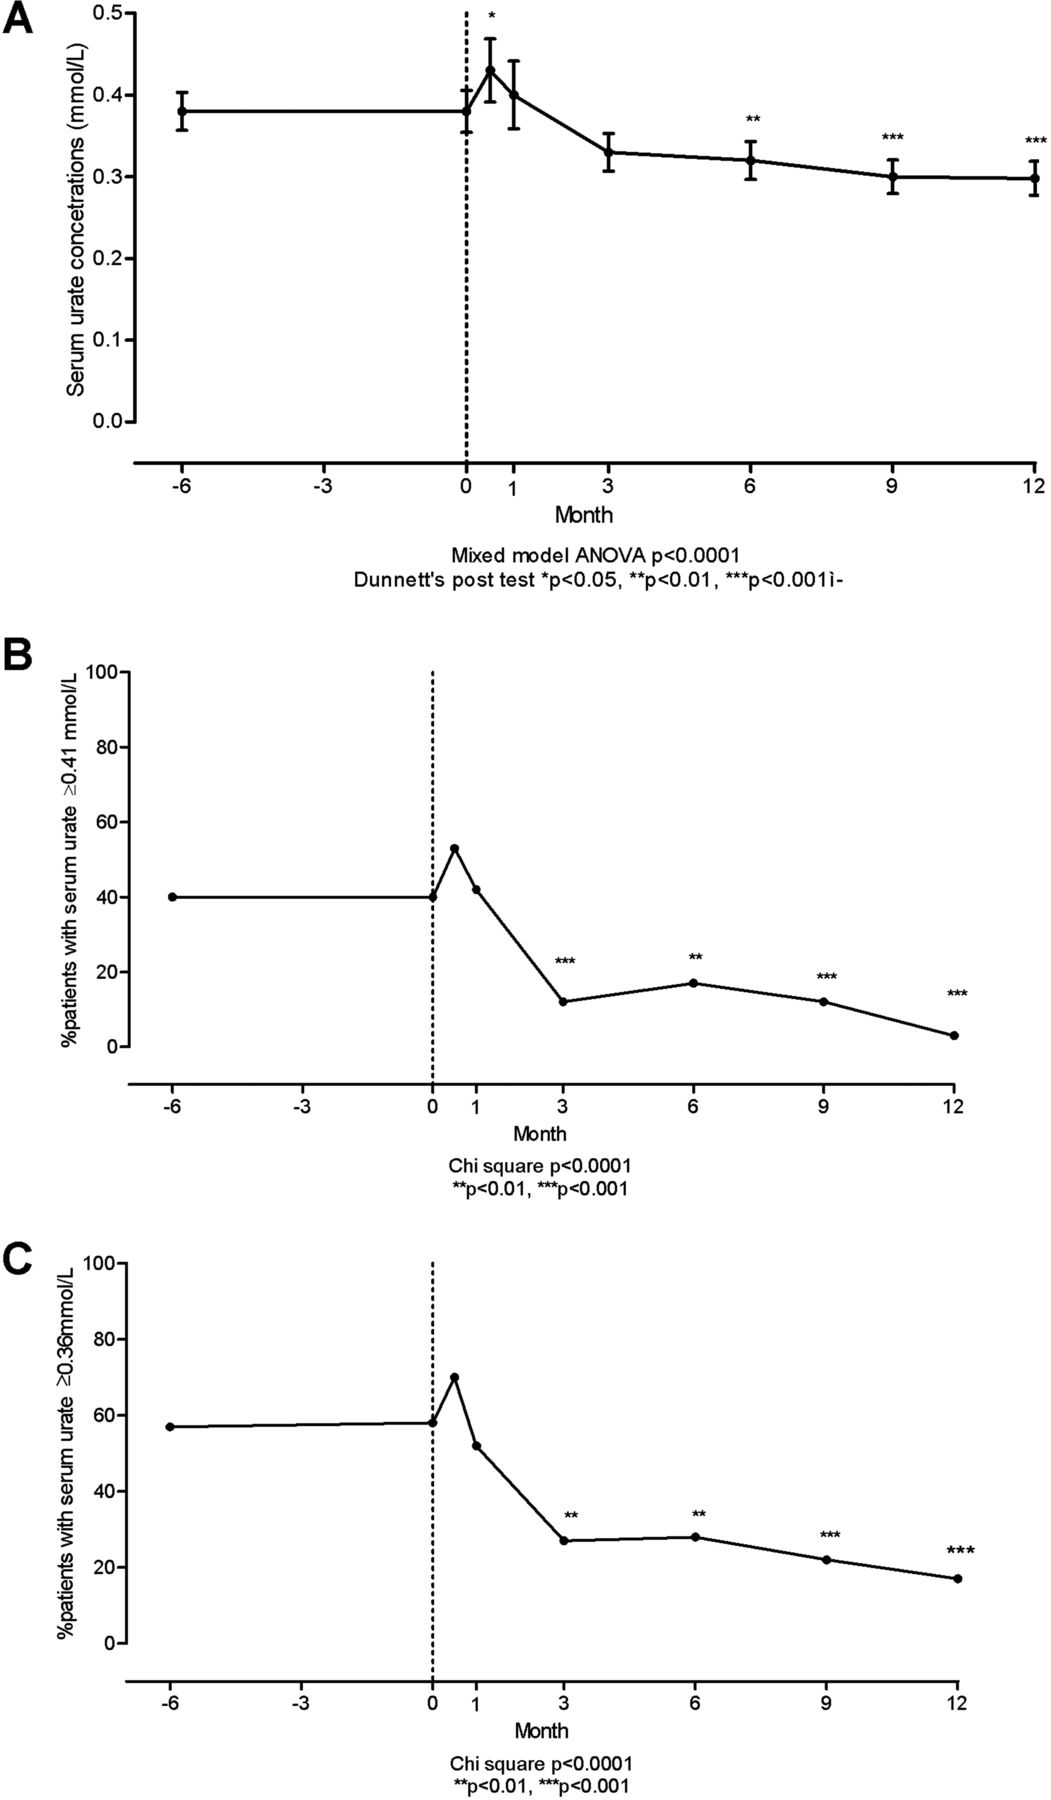
Changes in serum urate in the entire study group (n=60). (A) Serum urate (SU). Data are presented as mean (95% CIs). (B) Percentage of participants with SU concentrations above saturation levels (≥0.41 mmol/L). (C) Percentage of participants with SU concentrations above therapeutic treatment target levels (≥0.36 mmol/L). p Values refer to comparison with baseline (−6 months) values. Dashed line refers to day of surgery. For (B and C), all highlighted p were less than the Bonferroni p of 0.007.
At baseline and after the presurgical weight loss, there were 24 (40%) participants with SU above saturation (≥0.41 mmol/L) (p=0.99) (figure 2B). Similarly, the number of participants with SU≥0.36 mmol/L did not change from 34 (57%) at baseline to 35 (58%) participants after presurgical weight loss (p=0.74) (figure 2C).
Effects of surgical weight loss in the entire group
Two weeks following surgery, reductions were observed in weight, fasting glucose and HbA1c (figure 1A–C). However, the mean SU significantly increased in the postoperative period to 0.44 (0.15) mmol/L (p=0.038 compared with baseline) (figure 2A). Change in SU during this period correlated highly with change in serum creatinine (r=0.70, p<0.0001).
Further reductions in weight were observed at the 3 months’, 6 months’, 9 months’ and 12 months’ time-points (figure 1A). The mean (SD) weight loss achieved from the time of surgery to the final study visit (12 months after surgery) was 34.3 (11.1) kg. The range of weight loss was 18–74 kg. Reductions in fasting glucose, HbA1c, GFR and triglycerides were also observed throughout this period (figure 1B–F).
SU reduced from 3 months postoperatively and remained reduced throughout the remaining study period (figure 2A). The mean (SD) final SU was 0.30 (0.08) mmol/L (p=0.0002 compared with baseline). At the preoperative study visit, there were 24 (40%) participants with SU above saturation (≥0.41 mmol/L). One year postoperatively, there were two (3%) participants with SU above saturation (p<0.0001, compared with baseline visit) (figure 2B). Similarly, the number of participants with SU≥0.36 mmol/L reduced from 35 (58%) at the preoperative visit to 10 (17%) participants 1 year after surgery (p<0.0001, compared with baseline visit) (figure 2C).
Predictors of serum urate following surgery in the entire group
At baseline, 26 (43%) participants were taking diuretics (all thiazides for treatment of hypertension). At the final study visit, there were four (7%) participants taking diuretics (p<0.001 compared with baseline visit). In the entire group, mean systolic blood pressure reduced from 141 mm Hg to 130 mm Hg, and mean diastolic blood pressure reduced from 87 mm Hg to 81 mm Hg (p<0.001 for both). Stepwise linear regression analysis showed that the factors associated with change in SU at the final postoperative visit were baseline SU, cessation of diuretic therapy, change in serum creatinine and female sex (table 2). Age and changes in weight, HbA1c or fasting glucose were not associated with change in SU over the study period. Similarly, neither final fasting glucose and HbA1c levels nor ranges were associated with change in SU or final SU (table 2 and data not shown).
Stepwise linear regression analysis of change in serum urate at the final postoperative visit (12 months after surgery) in all participants
Outcomes in participants without gout at baseline
In participants without gout, mean (SD) weight reduced from 134.1 (24.3) kg at the baseline visit to 94.3 (16.5) kg at the final study visit (p<0.0001). The mean presurgical weight loss was 5.5 (3.8) kg and the mean surgical weight loss was 39.9 (13.5) kg. At baseline, the mean (SD) SU was 0.37 (0.9) mmol/L. After presurgical weight loss, the mean SU measured 0.37 (0.10) mmol/L (p=0.99). In the immediate postoperative period, mean SU increased to 0.42 (0.15) mmol/L, and at the final study visit, reduced to 0.29 (0.07) mmol/L (p<0.01 compared with baseline visit). At the baseline visit, 19/48 (40%) participants had a SU above saturation level (≥0.41 mmol/L). Following presurgical weight loss, 16/48 (33%) participants had SU above saturation (p=0.55 compared with baseline visit). At the final study visit, SU above saturation was observed in 1/48 (2%) participants (p<0.0001 compared with baseline visit). One patient experienced the first flare of gout during the study (6 months after surgery, SU 0.61 mmol/L at the time of the flare).
Outcomes in participants with gout at baseline
In the 12 participants with gout at baseline, mean (SD) weight reduced from 134.3 (24.3) kg at the baseline visit to 100.3 (16.3) kg at the final study visit (p<0.0001). The mean presurgical weight loss was 5.5 (5.2) kg and the mean surgical weight loss was 34.0 (11.0) kg. At baseline, the mean (SD) SU was 0.41 (0.7) mmol/L. After presurgical weight loss, the mean SU measured 0.44 (0.09) mmol/L (p=0.97). In the immediate postoperative period, the mean SU increased to 0.51 (0.13) mmol/L, and at the final study visit, reduced to 0.33 (0.09) mmol/L (p=0.019 compared with baseline visit). Similar reductions in SU were observed in those with and without gout (mean reduction in SU 0.08 mmol/L for both, p=0.87). At the baseline visit and following presurgical weight loss, 2/12 (17%) participants had SU below therapeutic target (0.36 mmol/L). At the final study visit, SU above therapeutic target was present in 8/12 (67%) participants (p=0.031 compared with baseline visit).
At the final study visit, 8/12 (67%) participants with gout were on no urate-lowering therapy. Mean weight loss in these participants from baseline was 40.6 (11.8) kg. For the eight participants on no urate-lowering therapy at the final study visit, mean SU was 0.36 (0.08) mmol/L at the final study visit. SU was above therapeutic target in 8/8 of these participants at baseline and 3/8 at follow-up (p=0.0043).
One gout flare was reported by three individual participants with established gout during the study period. None of these participants were taking allopurinol at any time during the study period. In one patient, the flare occurred in the postoperative period (with SU 0.72 mmol/L), and in the two other participants, flares occurred 3 months and 6 months after surgery.
Discussion
This study has demonstrated that profound surgical weight loss leads to clinically relevant reductions in SU in people with type 2 diabetes and WHO class II or higher obesity. In almost all participants without gout, SU was reduced to subsaturation concentrations following bariatric surgery. Furthermore, in the majority of participants with gout, bariatric surgery reduced SU to below therapeutic target concentrations, even after cessation of urate-lowering therapy in some cases.
Of interest, no change in SU was observed after non-surgical weight loss of more than 5 kg. These findings contrast with previous studies. The Multiple Risk Factor Intervention Trial showed a graded relationship between weight loss and achieving normouricaemia in men with high cardiovascular risk, with statistically significant effects observed even with weight loss of 1–5 kg over 7 years.21 Dessein et al22 reported an open study of dietary intervention to increase insulin sensitivity in 13 people with poorly controlled gout and mean BMI of 30.5 kg/m2. Participants achieved mean weight loss of 7.7 kg and substantial reductions were observed in gout flare frequency and SU (from 0.57 to 0.47 mmol/L). However, none of the participants with SU above therapeutic target at baseline reduced their SU into the target range. Importantly, in both previous studies, people with diabetes were excluded (in the Multiple Risk Factor Intervention Trial study, those with diabetes on medication were excluded) and mean baseline BMIs were substantially lower than our study. In the current study, all participants had diabetes and baseline BMI ≥35 kg/m2. It is possible that these differences in patient populations may account for the variable results between studies.
The observation that SU increases in the immediate postoperative period is of clinical relevance. Our data suggest that this increase may occur due to renal dysfunction associated with major surgery, although other metabolic effects due to fasting or rapid weight loss may also have contributed.23 Other groups have reported gout flares in the postoperative period in people undergoing bariatric surgery.24 ,25 This was also observed in one of our participants with established gout who developed a postoperative flare in the context of severe hyperuricaemia.
Our study indicates that improved renal function and cessation of diuretic therapy influence SU following substantial weight loss in people with morbid obesity and diabetes. The reductions in SU observed following bariatric surgery may be combined with other reported benefits of bariatric surgery including reduced risk of progressive degenerative joint disease,26 and reduction in inflammatory responses including those specific to MSU crystals.27 Furthermore, the reduction in SU may attenuate the systemic inflammatory response associated with metabolic syndrome through alteration of adipokines and proinflammatory cytokines such as monocyte chemotactic protein-1.28
We acknowledge the limitations of this study. This was a highly selected group, without major comorbidity, as would be expected for patients undergoing publicly funded bariatric surgery. People with morbid obesity but without diabetes, or people with comorbid conditions such as moderate-severe chronic kidney disease may not have the same SU responses as observed in this study. All participants underwent the same surgical procedure, and it is possible that other surgical procedures may have different effects on SU responses. Furthermore, it is not possible to conclusively determine whether the postsurgical changes in SU occurred as a result of surgery itself, modification in dietary intake following surgery, or the substantial weight loss that occurred as a result of the surgical procedure. The high Ma¯ori and Pacific ethnicity of our study group may limit the generalisability of this study, particularly since hyperuricaemia and gout also occur at high rates in these populations. Importantly, ethnicity was not an independent predictor of change in SU in the linear regression analysis. This study did not examine the relationship between insulin sensitivity and SU targets following bariatric surgery; future studies addressing this issue will be of great interest.
In summary, this study has demonstrated clinically relevant reductions in SU following bariatric surgery in people with diabetes and WHO class II or higher obesity. The reduction of SU to subsaturation levels indicate that the risk of developing gout may be substantially reduced in the majority of these people following bariatric surgery. Furthermore, for those with gout, morbid obesity and diabetes, bariatric surgery allows achievement of therapeutic target SU concentrations and may enable cessation of urate-lowering therapy.
References
Footnotes
Handling editor Tore K Kvien
-
Contributors ND conceived of the study, contributed to the data interpretation and drafted the manuscript. PC and MW coordinated data management. MW and CBB coordinated study visits. GDG completed statistical analysis. PJG conceived of the study and contributed to the data interpretation. BOW conceived of the study, contributed to the data interpretation and drafted the manuscript. All authors read and approved the final manuscript.
-
Funding This project was funded by the Health Research Council of New Zealand (grant number 09-591) and the Auckland Medical Research Foundation (grant number 1109014).
-
Competing interests None.
-
Patient consent Obtained.
-
Ethics approval The study was approved by the Northern X Ethics Committee.
-
Provenance and peer review Not commissioned; externally peer reviewed.