Article Text

Abstract
Objective Accumulation of mitochondria underlies T-cell dysfunction in systemic lupus erythematosus (SLE). Mitochondrial turnover involves endosomal traffic regulated by HRES-1/Rab4, a small GTPase that is overexpressed in lupus T cells. Therefore, we investigated whether (1) HRES-1/Rab4 impacts mitochondrial homeostasis and (2) Rab geranylgeranyl transferase inhibitor 3-PEHPC blocks mitochondrial accumulation in T cells, autoimmunity and disease development in lupus-prone mice.
Methods Mitochondria were evaluated in peripheral blood lymphocytes (PBL) of 38 SLE patients and 21 healthy controls and mouse models by flow cytometry, microscopy and western blot. MRL/lpr mice were treated with 125 μg/kg 3-PEHPC or 1 mg/kg rapamycin for 10 weeks, from 4 weeks of age. Disease was monitored by antinuclear antibody (ANA) production, proteinuria, and renal histology.
Results Overexpression of HRES-1/Rab4 increased the mitochondrial mass of PBL (1.4-fold; p=0.019) and Jurkat cells (2-fold; p=0.000016) and depleted the mitophagy initiator protein Drp1 both in human (−49%; p=0.01) and mouse lymphocytes (−41%; p=0.03). Drp1 protein levels were profoundly diminished in PBL of SLE patients (−86±3%; p=0.012). T cells of 4-week-old MRL/lpr mice exhibited 4.7-fold over-expression of Rab4A (p=0.0002), the murine homologue of HRES-1/Rab4, and depletion of Drp1 that preceded the accumulation of mitochondria, ANA production and nephritis. 3-PEHPC increased Drp1 (p=0.03) and reduced mitochondrial mass in T cells (p=0.02) and diminished ANA production (p=0.021), proteinuria (p=0.00004), and nephritis scores of lupus-prone mice (p<0.001).
Conclusions These data reveal a pathogenic role for HRES-1/Rab4-mediated Drp1 depletion and identify endocytic control of mitophagy as a treatment target in SLE.
- Autoimmune Diseases
- Autoimmunity
- Systemic Lupus Erythematosus
This is an Open Access article distributed in accordance with the Creative Commons Attribution Non Commercial (CC BY-NC 3.0) license, which permits others to distribute, remix, adapt, build upon this work non-commercially, and license their derivative works on different terms, provided the original work is properly cited and the use is non-commercial. See: http://creativecommons.org/licenses/by-nc/3.0/
Statistics from Altmetric.com
Introduction
Mitochondrial dysfunction, characterised by the persistent elevation of the mitochondrial transmembrane potential (ΔΨm) or mitochondrial hyperpolarisation (MHP), oxidative stress and depletion of intracellular adenosine triphosphate (ATP) and glutathione, plays fundamental roles in abnormal T-cell activation in patients with SLE.1–3 The mammalian target of rapamycin (mTOR) serves as a sensor of mitochondrial homeostasis in T cells4 and is activated in SLE patients.5 Blockade of mTOR with rapamycin improved disease activity in murine lupus6 and in SLE patients.7 N-acetylcysteine (NAC), which serves as both a precursor of glutathione and antioxidant in and of itself, also diminished disease activity in SLE patients, through inhibiting mTOR.8 However, mTOR blockade with either rapamycin7 or NAC failed to reverse MHP and the accumulation of mitochondria,8 indicating that mitochondrial dysfunction is located upstream of mTOR activation in SLE.
The efficacy of mTOR blockade is related to the reversal of enhanced Ca2+ signalling through the T-cell receptor,7 which is attributed to the lysosomal degradation of CD4 and CD3ζ5 and their substitution by FcɛRIγ9 which, in turn, are regulated by the small GTPase HRES-1/Rab4 through endosomal traffic.5 mTOR has been localised to endosomes,10 including those carrying HRES-1/Rab4.5 Polymorphic alleles of HRES-1 locus are associated with SLE11 ,12 and influence expression of HRES-1/Rab4,13 which may represent the gene product that confers susceptibility to lupus at 1q42.14 Although mTOR has been widely implicated in the suppression of autophagy,15 ,16 the opposing effects of rapamycin on the degradation of proteins, such as CD4 and CD3ζ, and organelles, such as mitochondria, both of which occur in lysosomes, appear paradoxical. During autophagy, proteins and organelles alike are carried to the lysosome as endosomal cargo.17 Therefore, we examined the role of HRES-1/Rab4, which is overexpressed in T cells of SLE patients,5 as a selective regulator of autophagy pathways, that is, facilitator of protein microautophagy and inhibitor of organelle macroautophagy.
Autophagy is a fundamental stress-induced catabolic process that moves cargo to the lysosome through three main mechanisms: (1) microautophagy, transferring cytoplasmic materials into the lysosome though endosome fusion, (2) chaperone-mediated autophagy that requires binding of a chaperone first to its cytosolic protein target and second to a receptor on the lysosomal membrane followed by translocation of the cytosolic protein into the lysosome and (3) macroautophagy, characterised by the formation of a cytosolic double-membrane vesicle primarily involving organelles such as mitochondria.18 Macroautophagy of mitochondria or mitophagy is initiated by the translocation of dynamin-related protein 1 (Drp1) from the cytosol to mitochondria, which causes the fission, fragmentation and lysosomal degradation of mitochondria.17 ,19 Here, we reveal that HRES-1/Rab4 promotes the lysosomal degradation of Drp1 in Jurkat human T cells. The overexpression of HRES-1/Rab4 increased mitochondrial mass in Jurkat cells and PBL. Drp1 was reduced in lupus T cells and was unaffected by mTOR blockade, similar to the persistence of mitochondrial accumulation in rapamycin-treated patients. Moreover, expression of the murine homologue of HRES-1/Rab4, Rab4A, was found to be increased, while Drp1 was found to be decreased in the spleen and thymus of lupus-prone NZB/W F1 and MRL/lpr mice relative to C57BL/6 controls at 4 weeks of age well before the onset of ANA production, proteinuria and glomerulonephritis (GN). Treatment with Rab geranylgeranyl transferase inhibitor 3-PEHPC, which inactivated HRES-1/Rab4, reversed the depletion of Drp1 as well as the accumulation of mitochondria, and prevented ANA production and nephritis in MRL/lpr mice.
Materials and methods
Human subjects
Thirty-eight patients with SLE were investigated; each patient satisfied the criteria for a definitive diagnosis.20 ,21 As controls, 21 healthy subjects were matched for gender, ethnicity and age within 10 years of SLE patients for each blood donation and studied in parallel. Additional details are provided in the online supplementary methods section.
Separation and culture of human PBL
Peripheral blood mononuclear cells (PBMC) were isolated from heparinised venous blood on Ficoll–Hypaque gradient. Peripheral blood lymphocytes (PBL) were separated from monocytes by adherence to autologous serum-coated Petri dishes.22 T cells (>95% CD3) were negatively isolated from PBMC with Dynal magnetic beads conjugated to IgG antibodies for CD14, CD16 human leukocyte antigen (HLA) class II DR/DP, CD56 and CD235a; Invitrogen Cat No 113-11D). CD4 T cells (>98% CD4) were negatively isolated with magnetic beads conjugated to IgG antibodies for CD8, CD14, CD16, HLA class II DR/DP, CD56, CDw123 and CD235a (Invitrogen Cat No 113-39D). The resultant cell population was resuspended at 106 cells/mL in RPMI 1640 medium, supplemented with 10% fetal calf serum (FCS), 2 mM L-glutamine, 100 IU/mL penicillin, and 100 µg/mL gentamicin in 12-well plates at 37°C in a humidified atmosphere with 5% CO2. Cross-linking of the CD3 antigen was performed by addition of cells to plates precoated with 1 µg/mL OKT3 monoclonal antibody (CRL 8001 from ATCC, Rockville, MD) for 1 h at 37°C. CD28 costimulation was performed with 500 ng/mL mAb CD28.2 (Pharmingen, San Diego, California).
Mice
Female New Zealand White (NZW), NZW×New Zealand Black F1 (NZB/W F1), B6.NZMSle1/Sle2/Sle3, MRL, MRL/lpr, C57BL/6 (B6), and C57BL/6.Lpr (B6/Lpr) mice were obtained from Jackson laboratories (Bar Harbor, ME). Additional details are provided in the online supplementary methods section.
Mouse embryonic fibroblasts (MEFs)
MEFs deficient in Drp123 and control MEFs were cultured in DMEM medium supplemented with 10% FBS, 2 mM L-glutamine, 100 U/mL penicillin, 100 µg/mL streptomycin, 10 µg/mL amphotericin B, 1% MEM non-essential amino acid solution (10 mM, Invitrogen), and 1 mM sodium pyruvate.23
Flow cytometric analysis of ΔΨm, mitochondrial mass and nitric oxide
Flow cytometry was performed on freshly isolated cells, as described in the online supplementary methods section.
Microarray analysis of gene expression
Biotinylated cRNA was produced by in vitro transcription and hybridised to Affymetrix HG-U133 Plus-2 chips, as described in the online supplementary methods section.
Western blot analysis
Protein lysates were separated by SDS-PAGE, transferred to nitrocellulose, probed with antibodies, and analysed, as described in the online supplementary methods section.
Transfection of siRNA
Knock-down of HRES-1/Rab4 via siRNA transfection is described in the online supplementary methods section.
Transduction of HRES-1/Rab4 by adeno-associated virus
HRES-1/Rab4 cDNA was cloned upstream of the internal ribosomal entry site (IRES) in pAAV-IRES-GFP vector, as described in the online supplementary methods section.
Confocal microscopy
Lysosomal compartments were labelled LysoTracker Red (LTR). Mitochondria were visualised by staining with MitoTracker Deep Red (MTDR). Additional details are provided in the online supplementary methods section.
Autophagy induction
Autophagy was induced with 50 nM rapamycin in the presence and absence of lysosomal inhibitor, 200 nM bafilomycin A1, as described in the online supplementary methods section.
In vitro prenylation assay
Prenylation of HRES-1/Rab4 and Rab5 was evaluated by western blot of soluble and insoluble fractions from Triton×114-treated Jurkat cells, as described in the online supplementary methods section.
Treatment of MRL/lpr mice with Rab geranylgeranyl transferase inhibitor 3-PEHPC and rapamycin
4-week-old MRL/lpr mice were separated into four treatment groups receiving phosphate-buffered saline (PBS) (solvent control for 3-PEHPC; n=4), 125 µg/kg 3-PEHPC in PBS (n=8), 0.2% carboxymethylcellulose (CMC, solvent control for rapamycin, n=4), or 1 mg/kg rapamycin in CMC (n=8). Proteinuria was monitored every 2 weeks between 4–14 weeks of age. To assess treatment toxicity, mice were weighed weekly. Renal pathology was assessed by scoring for glomerulonephritis (GN), glomerulosclerosis (GS), and interstitial nephritis (IN) on a 0–4 scale, and percentage of sclerotic and crescentric glomeruli, as described in the online supplementary methods section.
ANA and cytokine assays
ANA, IFN-γ, IL-10 and IL-17A were measured by ELISA, as described in the online supplementary methods section.
Statistical analyses
Statistical analyses were performed using Statview V.5.0.1 (SAS Institute, Cary, North Carolina) and GraphPad Prism V.5.0 Software (San Diego, California). Additional details are provided in the online supplementary methods section.
Supplementary materials include supplemental methods and online supplementary figures S1–S7.
Results
HRES-1/Rab4 promotes the lysosomal degradation of Drp1
To assess the impact of HRES-1/Rab4 on autophagy pathways, we evaluated global gene expression in Jurkat cells carrying doxycycline-inducible GFP-producing, HRES-1/Rab4 and GFP-producing, or dominant-negative HRES-1/Rab4S27N (HRES-1/Rab4-DN) and GFP-producing expression vector following incubation with or without doxycycline for 24 h13; 116 genes exhibited doxycycline-induced reciprocal changes of expression in response to HRES-1/Rab4 relative to HRES-1/Rab4-DN at 99.99% CIs (data not shown). Pathway analysis on the basis of protein–protein interaction with Strings 9.0 software (http://string-db.org) indicated a predominant influence of HRES-1/Rab4 on genes involved in mitochondrial outer membrane organisation (false discovery rate p value with Bonferrroni correction (FRD p=1.8×10⁻⁹), membrane raft formation (p=7.5×10⁻⁹), and mTOR activation (p=9.7×10⁻³). The predictive protein interactome analysis implicated genes in addition to the ones revealed by the microarray studies, such as Drp1 and AKAP10. Drp1 initiates the fission and autophagy of mitochondria.19 In turn, Drp1 is phosphorylated by protein kinase A (PKA)19 that associates with the endosomal membrane via the PKA anchoring protein AKAP10.24 As mitochondrial turnover involves endosomal traffic regulated by HRES-1/Rab4, a small GTPase that is overexpressed in lupus T cells, it was important to evaluate the impact of HRES-1/Rab4 on Drp1 and AKAP10.
The functional consequences of HRES-1/Rab4 overexpression on Drp1 were initially evaluated in Jurkat human T cells. As shown in figure 1A, the over-expression of HRES-1/Rab4 reduced Drp1 protein levels by 49% (p=0.01). The phosphorylation of Drp1 at Ser 637 was also reduced by HRES-1/Rab4 (66% decrease, p=0.005, figure 1A). As Drp1 is phosphorylated at Ser 637 by PKA, which is anchored to endosomes via AKAP10,24 we also evaluated the effect of HRES-1/Rab4 on AKAP10. As shown in figure 1A, AKAP10 protein levels were reduced by HRES-1/Rab4-DN. Both the HRES-1/Rab4-induced depletion of Drp1and the HRES-1/Rab4-DN-induced depletion of AKAP-10 were strikingly reversed in bafilomycin-treated Jurkat cells (figure 1A), suggesting a role for increased lysosomal degradation. Along these lines, the knockdown of HRES-1/Rab4 markedly upregulated Drp1 protein levels in HeLa cells which were amenable to transfection by siRNA without loss of viability (figure 1B). As expected, the deletion of Drp1 increased mitochondrial mass in MEFs (figure 1C) which was consistent with a role for Drp1 in promoting mitophagy.19 In the absence of Drp1, the expression of Rab4A, the mouse homologue of HRES-1/Rab4, was diminished (figure 1C).

Depletion of Drp1 by HRES-1/Rab4. (A) Effect of HRES-1/Rab4 on Drp1 protein levels, phosphorylation of Drp1 at Ser 637, and levels of AKAP10, which regulates phosphorylation of Drp1, were evaluated in Jurkat human T cells carrying doxycyclin-inducible vectors that express wild-type HRES-1/Rab4 or dominant-negative HRES-1/Rab4S27N (HRES-1/Rab4-DN). Bafilomycin reversed the depletion of Drp1 by HRES-1/Rab4 and depletion of AKAP10 by HRES-1/Rab4-DN. Left panel, representative western blots; right panel, mean±SEM of 4–6 experiments. (B) Upregulation of Drp1 protein levels by siRNA-mediated knock-down of HRES-1/Rab4. Left panel, HRES-1/Rab4 and Drp1 were analysed relative to β-actin in HeLa cells 48 h after transfection with siRNA specific for HRES-1/Rab4 nucleotides 377–399 or scrambled siRNA. Right panel, mean±SEM of five independent experiments. (C) Effect of Drp1 deletion in MEFs on Rab4 protein levels assessed by western blot and on mitochondrial mass measured by MTG fluorescence. Representative western blot (left panel) and bar chart reflect mean±SEM of 4 experiments (right panel).
HRES-1/Rab4 induced the accumulation of mitochondria by inhibiting mitophagy
Next, we investigated if the HRES-1/Rab4-mediated depletion of Drp1 elicited changes in mitochondrial mass. Jurkat cells overexpressing HRES-1/Rab4 exhibited twofold greater mitochondrial mass by MTDR staining (p=1.6×10⁻⁵; see online supplementary figure S1A and B). Accumulation of mitochondria was also indicated by 1.7-fold elevated voltage-dependent anion channel (VDAC) protein levels in Jurkat cells overexpressing HRES-1/Rab4 (p=0.03; data not shown). To investigate the role of autophagy in the effect of HRES-1/Rab4 on mitochondria, we examined their association with lysosomes. The colocalisation of mitochondria with lysosomes was diminished in cells overexpressing HRES-1/Rab4 (see online supplementary figure S1). Mitochondrial mass was also increased in PBL overexpressing HRES-1/Rab4 (1.4-fold; p=0.019; figure 2A). Consistent with its impact on mitochondrial homeostasis, HRES-1/Rab4 was enriched in mitochondria relative to the cytosol both in Jurkat cells (not shown) and PBL (figure 2B). The partitioning of HRES-1/Rab4 to mitochondria was markedly reduced in lupus T cells relative to matched healthy controls (−52±12%, p=0.005; figure 2B). The diminished localisation of mitochondria to lysosomes upon HRES-1/Rab4 overexpression in Jurkat cells, the diminished association of HRES-1/Rab4 with mitochondria in lupus PBL, and the accumulation of mitochondrial mass in Jurkat cells and PBL overexpressing HRES-1/Rab4 together suggested an underlying mechanism of inhibited mitophagy.

HRES-1/Rab4A promotes the accumulation of mitochondria in human PBL. (A) Effect of HRES-1/Rab4 overexpression on mitochondrial mass assessed in healthy control PBL stimulated with 5 μg/mL ConA for 24 h. Left panel, expression levels of adeno-associated virus (AAV)-transduced HRES-1/Rab4 was monitored by western blot. Control reflects PBL infected with AAV lacking HRES-1/Rab4 cDNA. Right panel, Assessment of mitochondrial mass by MitoTracker Deep Red (MTDR) fluorescence using flow cytometry. Data represent mean±SEM in five healthy donors. p Values reflect comparison of MTDR fluorescence in PBL infected with HRES-1/Rab4-producing AAV relative to PBL infected with control AAV using paired two-tailed t test. (B) Partitioning of HRES-1/Rab4 between the cytosol and mitochondria. Left panel, western blot analysis of HRES-1/Rab4, TAL, and VDAC in cytosolic and mitochondrial fractions of negatively isolated T cells from SLE and matched healthy subjects. Right panel, cumulative data represent mean±SE of HRES-1/Rab4 partitioning between the cytosol and mitochondria in nine lupus patients relative to the mean mitochondria/cytosol ratio of nine healthy controls normalised to 1.0.
Stimulation of microautophagy by HRES-1/Rab4
Since early endosomes are involved in the formation of autophagosomes,16 we examined the effect of HRES-1/Rab4 on lipidation of the microtubule-associated light chain 3 (LC3) with phosphoethanolamine, an early event of autophagosome formation.25 While the lipidated LC3 (LC3-II) is associated with the membrane of autophagosomes, the unlipidated form of LC3 (LC3-I) resides in the cytosol16 These studies were performed (1) in the absence or presence of bafilomycin A1 to allow accumulation of autophagosomal proteins through blocking their maturation into autophagolysosomes and (2) in the absence or presence of rapamycin to induce autophagy.25 Endogenous LC3-II was only detectable after treatment with bafilomycin A1 and enhanced by rapamycin (see online supplementary figure S2). LC3-II levels generated from endogenous LC3 were increased by wild-type HRES-1/Rab4 (see online supplementary figure S2A), indicating an overall stimulation of autophagy. Along this line, the generation of LC3-II from transfected FP650-LC3 fusion protein was diminished by HRES-1/Rab4-DN (see online supplementary figure S2B). The effect of HRES-1/Rab4 on the accumulation of LC3-II was not affected by rapamycin (see online supplementary figure S2A), indicating that the stimulation of autophagy by genetically enforced overexpression of HRES-1/Rab4 was not dependent on mTOR.
Drp1 expression is reduced and resistant to rapamycin treatment in SLE
Since HRES-1/Rab4 depleted the mitophagy initiator Drp1, we investigated if overexpression of HRES-1/Rab45 and accumulation of mitochondria in lupus T cells26 were associated with altered expression of Drp1. As shown in figure 3, Drp1 protein levels were reduced by 86±3% in lupus PBL in comparison with matched controls (p=0.012). Diminished Drp1 levels were not corrected in SLE patients treated with rapamycin in vivo (−83±7%, p=0.017; figure 3), which was consistent with the enduring accumulation of mitochondria in rapamycin-treated patients.7 Autophagy regulator beclin-118 expression was also reduced in freshly isolated SLE PBL (−56±9%, p=0.002) but reversed by rapamycin treatment (p=0.01, figure 3). Since autophagy is required for T-cell activation,27 we investigated the capacity of lupus T cells to upregulate the expression of LC3 in response to CD3/CD28 costimulation. Indeed, the accumulation of LC3-II was 1.9-fold increased in lupus patients in comparison with healthy controls (p=8.8×10⁻⁵, figure 3). As expected, the LC3-II/LC3-I ratio was further enhanced by rapamycin (figure 3). In accordance with earlier findings,7 rapamycin treatment reduced mTOR activity but did not reverse the accumulation of mitochondria in lupus T cells (data not shown). These findings suggested that the depletion of Drp1 (figure 3) along with the accumulation of mitochondria is independent of mTOR activation in SLE.

Assessment of Drp1, Beclin 1, and LC3 expression relative to β-actin by western blot analysis of protein lysates from PBL of healthy donors (n=12) and lupus patients treated without (n=14) or with rapamycin (n=10). Representative western blots are shown in left panels and cumulative analyses are shown in right panels. p Values <0.05 are indicated.
Increased expression of Rab4A and depletion of Drp1 precede accumulation of mitochondria and disease development in lupus-prone mice
To assess the involvement of Rab4A in lupus pathogenesis, we examined its expression in lupus-prone mice relative to disease development.28 ,29 Disease-free mice were studied at 4 weeks of age, when we confirmed the absence of ANA, proteinuria, or nephritis. Rab4A expression was markedly increased (4.7-fold; p=0.0002; figure 4A) while Drp1 was diminished in T cells of 4-week-old female MRL/lpr mice (−54%, p=0.02; figure 4B). Expression of Rab4A was further increased at 8 weeks of age (36-fold; p=0.0005; figure 4C) when accumulation of mitochondria was evidenced by western blot detection of VDAC and MTG fluorescence in MRL/lpr mice (figure 4D). Rab4A and Drp1 protein levels were similar in naïve CD44lowCD62LhighCD4 T cells of B6/Lpr, MRL, and MRL/lpr mice relative to B6 controls (data not shown). Expression of Rab5, evaluated as a control Rab GTPase that mediates endocytic internalisation, was not altered in MRL/lpr, MRL, or B6/lpr relative to B6 mice (figure 4C).

Increased expression of Rab4A and depletion of Drp1 in MRL/lpr and NZB/W F1 mice. (A) Western blot analysis of Rab4A and Rab5 expression in thymocytes from 4-week-old C57BL/6 (B6), MRL, C57BL/6/Lpr (B6/Lpr), and MRL/lpr mice. Representative blots are shown in the left panel, while cumulative analyses are shown in the right panel. p Values <0.05 are indicated. (B) Western blot analysis of Drp1 in negatively isolated T cells of 4-week-old mice. (C) Western blot analysis of Rab4A and Rab5 expression in splenocytes from 8-week-old mice. (D) Western blot detection of VDAC and flow cytometry of mitochondrial mass using MTG fluorescence in splenocytes of 8 week-old mice. For each parameter 4 or more mice were analysed; p values <0.05 are indicated. (E) Western blot analysis of Drp1 protein levels in B6 mouse splenocytes transduced with adeno-associated virus (AAV) expressing HRES-1/Rab4 (left panel). Data represent mean±SEM of five experiments; p values reflect comparison to cells infected with control AAV using paired two-tailed t test (right panel).
At 4 weeks of age, we also observed a robust overexpression of Rab4A and depletion of Drp1 in splenocytes of female NZB/W F1 mice (figure 4E). In support of a mechanistic relationship between reciprocal changes in Rab4A and Drp1, overexpression of HRES-1/Rab4 reduced Drp1 protein levels in B6 splenocytes by −41±7.8% (p=0.034; figure 4F).
Rab4A expression was also increased in thymocytes of 4-week-old NZB/W F1 mice (see online supplementary figure S3A), showing no evidence of ANA production, proteinuria, or nephritis (data not shown). NZB/W F1 mice were also studied at 4 months and 6 months of age, when autoimmunity was detected by the production of ANA, and at 11 months of age when all mice developed nephritis of varying severity. At 4 months of age, Rab4A expression was further increased in splenocytes of NZB/W F1 mice, over 15-fold relative to age-matched B6 controls. To a lesser extent, Rab4A was overexpressed in splenocytes of 4-month-old B6.NZMSle1.Sle2.Sle3 mice (see online supplementary figure S3A). Rab5A was unchanged in splenocytes at 4 weeks of age, but it was overexpressed at 4 months of age in NZB/W F1 mice (p=0.02; see online supplementary figure S3B).
Since HRES-1/Rab4 targets CD3ζ and CD4 for lysosomal degradation, we examined this process in NZB/W F1 mice. CD3ζ expression was reduced, while CD4 expression was unchanged in T cells of 4-week-old NZB/W F1 mice in comparison with B6 controls (see online supplementary figure S3C). At 4 months of age, CD3ζ was further depleted and CD4 expression also became diminished (see online supplementary figure S3C). Beclin-1 expression was reduced in T cells from NZB/W F1 and NZW mice (see online supplementary figure S3D). Drp1 protein levels were also diminished in thymocytes of NZB/W F1 mice relative to B6 controls (see online supplementary figure S3D). Increased nitric oxide (NO) production was detectable in 4-week-old NZB/W F1 mice (see online supplementary figure S3E).
mTOR activity was not consistently elevated at 4 weeks of age but it was robustly increased in 4-month-old NZB/W F1 mice (see online supplementary figure S4). Disease progression was associated with the escalation of Rab4A overexpression, (4.3-fold at 4 weeks of age and 15.3-fold at 4 months of age) and activation of mTOR (0.8-fold at 4 weeks of age and 3.3-fold at 4 months of age; p=0.028 using 2-way analysis of variance) in the spleen of NZB/W F1 female mice with respect to age-matched B6 female controls (see online supplementary figure S4). A progressive decrease of mitochondrial mass was observed in B6 mice with aging (see online supplementary figure S5A). By contrast, NO production, MHP and accumulation of mitochondria, as detected by increased MTG fluorescence (see online supplementary figure S5B) and VDAC expression (see online supplementary figure S5C), were peaking in 11-month-old NZB/W F1 mice. Thus, lupus-prone mice exhibit overexpression of Rab4A, depletion of Drp1, accumulation of mitochondria, and mTOR activation, similar to patients with SLE.5 ,26
Rab geranylgeranyl transferase blockade reverses Drp1 depletion, mitochondrial accumulation, ANA production, and nephritis in lupus-prone mice
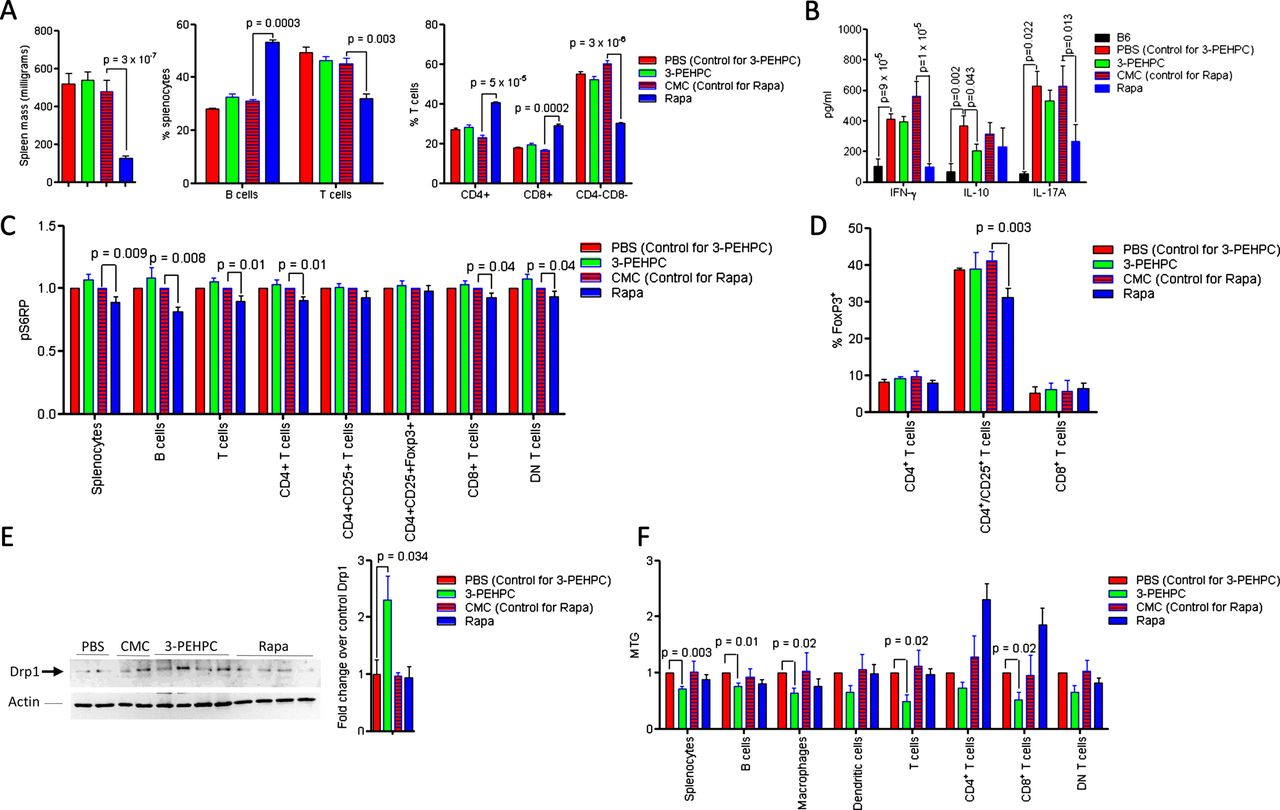
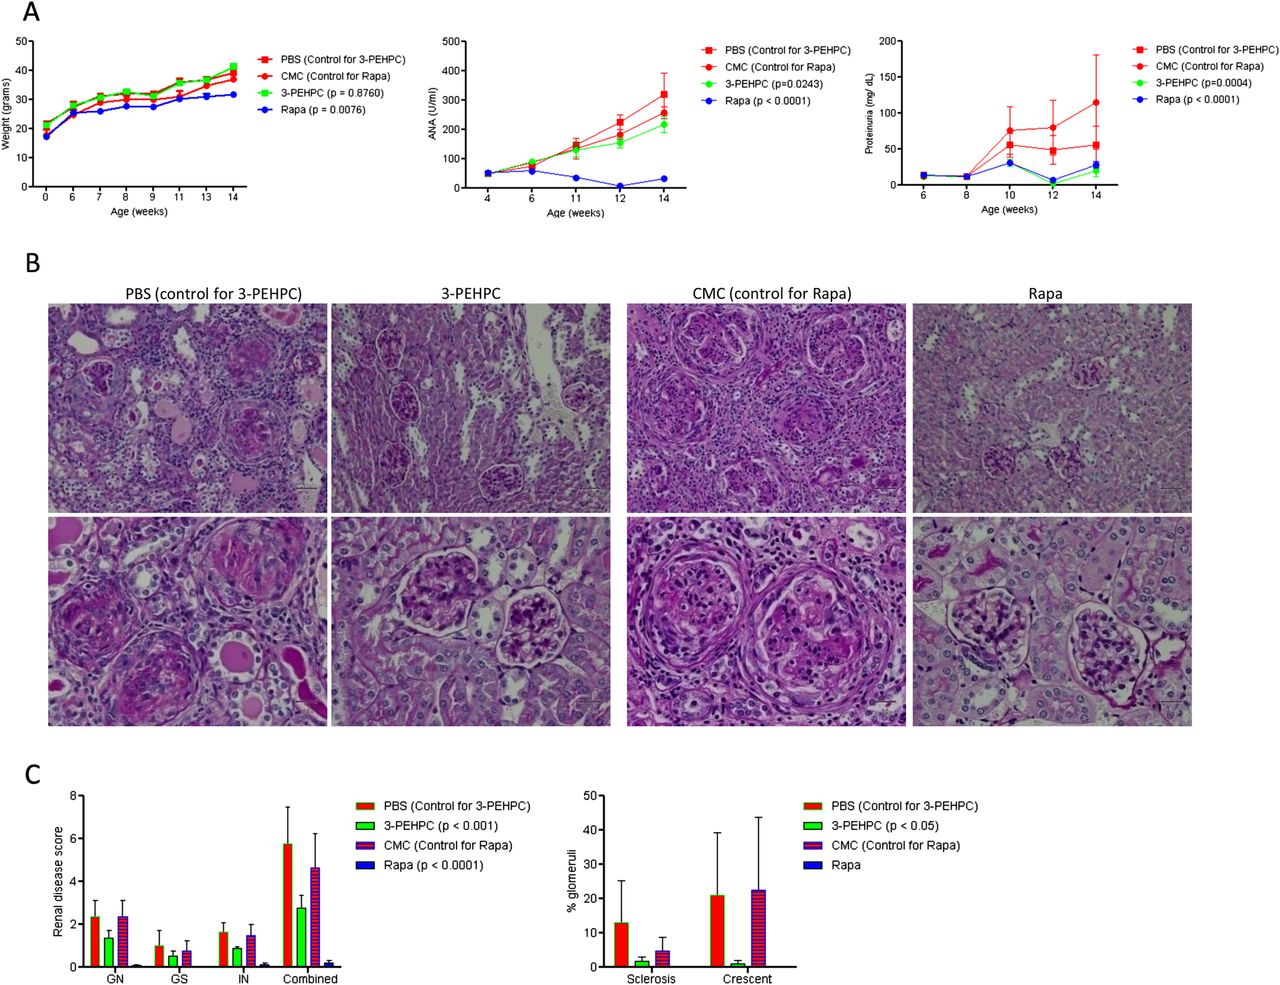
Increased Rab4A and depleted Drp1 were thus observed in 4-week-old disease-free MRL MRL/lpr and NZB/W F1 mice, indicating that these changes may represent early events in lupus pathogenesis. The accumulation of mitochondria was noted in 8-week-old MRL/lpr and 11-month-old NZB/W F1 mice. This was consistent with earlier development of autoimmunity in MRL/lpr mice.28 To evaluate Rab4 and the pathway of endocytic recycling as target for treatment of SLE, we used a Rab geranylgeranyl transferase inhibitor 2-[3-pyridinyl]-1-hydroxyethylidene-1,1-phosphonocarboxylic acid (3-PEHPC)30 that promoted the partitioning of HRES-1/Rab4 and Rab5 from the membrane to the cytosol compartment (see online supplementary figure S6). MRL/lpr mice were treated from 4 to 14 weeks of age, three times weekly, with subcutaneous injection of 125 µg/kg 3-PEHPC, previously found to be effective in diminishing bone resorption.30 We compared the efficacy of 3-PEHPC to rapamycin, a potent inhibitor of lupus disease activity in mice6 and humans.7 Relative to the toxicity of rapamycin noted in previous studies,31 3-PEHPC did not elicit weight loss (figure 5A). Rapamycin-treated mice had 137 mg/dl glucose in their urine at 14 weeks of age, while 3-PEHPC-treated mice had no glucosuria (p=0.04). 3-PEHPC reduced ANA production, proteinuria and nephritis (figure 5A–C). Rapamycin, but not 3-PEHPC, reduced spleen mass and the expansion of CD4−CD8− double-negative (DN) T cells (figure 6A). 3-PEHPC reduced IL-10, while rapamycin diminished IFN-γ and IL17A levels in the serum of MRL/lpr mice (figure 6B). As expected, rapamycin treatment inhibited mTOR activity (figure 6C) and reduced the numbers of FoxP3+ cells within the CD4CD25 T-cell compartment (figure 6D) in accordance with recent findings that mTOR is required for development of Tregs in mice32; thus, these cells may not be responsible for suppression of autoimmunity in this model. Unlike rapamycin, 3-PEHPC did not reduce spleen mass (figure 6A),33 expansion of DN T cells (figure 6A)34 or mTOR activity (figure 6C). 3-PEHPC, but not rapamycin, reversed the depletion of Drp1 (figure 6E) and diminished the mitochondrial mass of B and T cells and macrophages in MRL/lpr mice (figure 6F).

Effect of 3-PEHPC and rapamycin (Rapa) relative to solvent controls PBS and CMC, respectively, on autoimmunity and nephritis in MRL/lpr mice treated three times weekly, between ages of 4–14 weeks. (A) Body weight, ANA production, and proteinuria. (B) Renal pathology of 14-week-old mice. Upper and lower panels represent 200-fold and 400-fold original magnifications of identical sections; size bars represent 50 microns. PBS: GN is characterised by circumferential, predominantly cellular crescents with segmental sclerosis and hyalinosis. There are prominent interstitial lymphocytic infiltrates, tubular atrophy and protenaceous casts. 3-PEHPC: glomeruli are free of crescents. There is minimal tubular atrophy and interstitial fibrosis. CMC: glomeruli show cellular or fibrocellular crescents. Glomerular tufts are hypercellular with lobular accentuation. There is tubular atrophy and interstitial lymphocytic infiltrates and fibrosis. Rapa: normocellular glomeruli; minimal tubular atrophy and interstitial fibrosis. (C) Renal disease scores in 14-week-old MRL/lpr mice. Left panel, for each kidney, the severity of GN, GS, and IN was graded in a 0–4 semiquantitative scale. Right panel, numbers of glomeruli with sclerosis and/or crescent formation were determined and expressed as a percentage of total glomeruli observed in the entire cortical field. p values <0.05 reflect two-way analysis of variance.
Effect of 3-PEHPC and Rapa relative to solvent controls PBS and CMC, respectively, on the immune system and mitochondrial homeostasis of MRL/lpr mice treated weekly between ages of 4–14 weeks, as described under figure 5. (A) Effect of 3-PEHPC and Rapa on spleen size, B and T cells, as well as CD4, CD8 and DN T-cell frequencies. (B) Effect of 3-PEHPC and Rapa treatment on IFN-γ, IL-10, and IL-17A levels in serum of 14-week-old MRL/lpr mice. (C) Effect of 3-PEHPC and Rapa treatment on mTOR activity in spleen subsets of 14-week-old MRL/lpr mice. (D) Effect of 3-PEHPC and Rapa treatment on Foxp3 expression in CD4, CD4/CD25 and CD8 T cells. (E) Prevention of Drp1 depletion by 3-PEHPC in 14-week-old MRL/lpr mice. Representative (left panel) and cumulative western blot analyses of negatively isolated T cells from MRL/lpr mice-treated PBS, CMC, 3-PEHPC and Rapa (right panel). (F) Effect of 3-PEHPC and Rapa treatment on mitochondrial mass (MTG) in spleen lymphocyte subsets of 14-week-old MRL/lpr mice. p Values <0.05 reflect comparison with unpaired two-tailed t test.
Discussion
The present data identify HRES-1/Rab4 as a selective regulator of autophagy, promoter of microautophagy and inhibitor of mitophagy, thus contributing to the accumulation of mitochondria and serving as a potential target for treatment in SLE (see online supplementary figure S7). The increased turnover of LC-3 and depletion of autophagy regulator Beclin 118 demonstrate an overall activation of microautophagy in SLE. HRES-1/Rab4 stimulates microautophagy and lysosomal degradation of proteins which are recycled through early endosomes, such as the membrane receptors CD71, CD4,13 and CD3ζ5 and mitophagy initiator Drp1.17 ,19 We previously showed that HRES-1/Rab4 accelerated the recycling and lysosomal degradation of CD413 and CD3ζ but not CD8.5 The present study uncovers that the scope of proteins targeted for lysosomal degradation by HRES-1/Rab4 includes Drp1. The depletion of Drp1 by HRES-1/Rab4 has been solely attributed to lysosomal degradation, as microarray analyses revealed no changes in Drp1 transcription in cells overexpressing HRES-1/Rab4 or HRES-1/Rab4-DN. As Drp1 is phosphorylated at Ser 637 by PKA,19 which is anchored to endosomes via AKAP1024 the down-regulation of AKAP-10 by HRES-1/Rab4-DN indicates that phosphorylation of Drp1 may be regulated by an interaction of HRES-1/Rab4 with AKAP10. Further studies are needed to precisely delineate the mechanism of interactions between HRES-1/Rab4, Drp1 and AKAP10.
In accordance with the role of Drp1 in initiating the fission, fragmentation and lysosomal degradation of mitochondria through mitophagy,17 ,19 the depletion of Drp1 by HRES-1/Rab4 leads to increased mitochondrial mass in Jurkat cells and primary human peripheral blood T cells. The paucity of Drp1 prevents mitochondrial fission and promotes unopposed mitochondrial fusion35 which is consistent with the formation of megamitochondria in lupus T cells.26 The importance of mitochondrial homeostasis in lupus pathogenesis has also been supported by the recent identification of an NZB/W F1-derived lupus susceptibility gene as oestrogen-related receptor gamma, which accounts for increased mitochondrial mass that is detectable by elevated VDAC protein levels in the spleen of Sle1c2 mice.36
Importantly, Rab4A, but not Rab5, was robustly overexpressed in the spleen and thymus of lupus-prone mice. The activation of Rab4A and depletion of Drp1 were detected at age of 4 weeks, well before the onset of ANA production and nephritis in NZB/W F1 or MRL/lpr mice. The overexpression of HRES-1/Rab4 led to the depletion of Drp1 both in human and murine lymphocytes, supporting a causal relationship between reciprocal changes in Rab4A and Drp1 both in lymphocytes of SLE patients and lupus-prone mice. The inactivation of Drp1 reduced Rab4A expression and increased mitochondrial mass in MEFs, which was compatible with the molecular order that overexpression of HRES-1/Rab4 and increased endocytic recycling were upstream of Drp1 depletion and mitochondrial accumulation in SLE.
Rab5 overexpression and CD4 depletion were detectable in the spleen of NZB/W F1 mice at 4 months of age, suggesting a step-wise activation of endosome recycling with progression of disease pathogenesis and mimicking the reciprocal overexpression of small GTPases HRES-1/Rab4 and Rab5 and depletion of CD4 and CD3ζ in T cells of SLE patients.5 We found that expression levels of Rab4A and Drp1 in naïve CD4 T cells of B6 mice were not different relative to those of B6/Lpr, MRL and MRL/lpr mice (data not shown). CD3/CD28 costimulation for 24 h reduced Drp1 levels in human PBL by 80.8±9.4% (p=0.007; data not shown). As earlier documented, CD3/CD28 costimulation increased HRES-1/Rab4 protein levels in human T cells.5 These findings indicate that Rab4A overexpression and Drp1depletion may depend on T-cell activation in SLE. Increased production of NO during T-cell activation37 which induces the expression of HRES-1/Rab4 in vitro,5 may underlie the overexpression of Rab4A in 4-week-old NZB/W F1 mice. Lupus-associated polymorphic haplotypes within the long terminal repeat-enhancer12 also influence expression of HRES-1/Rab4 in human T cells.13
Blocking of Rab geranylgeranyl transferase activity with 3-PEHPC prevented Drp1 depletion, accumulation of mitochondria in T and B cells, ANA production and nephritis, indicating that activation of the endocytic recycling machinery contributes to the pathogenesis of SLE. The reversal Drp1 depletion by 3-PEHPC may influence T-cell activation through positioning of mitochondria at the immunological synapse38 Mitochondria serve as a buffer for the management of T-cell activation-induced Ca2+ fluxing,26 and Drp1-dependent fragmentation of the mitochondrial network may protect T cells from hyperactive Ca2+ signalling.38 This mechanism is supported by the reduction of cytosolic Ca2+ in T cells of 3-PEHPC-treated MRL/lpr mice (data not shown). Interestingly, rapamycin failed to reverse Drp1 depletion or to reduce mitochondrial mass, suggesting that the accumulation of mitochondria is mTOR-independent. These findings are consistent with the persistence of MHP and accumulation of mitochondria in T cells of SLE patients upon mTOR blockade with rapamycin5 ,7 or NAC.8
In addition to the distinct impact on mitochondrial homeostasis, the cytokine profile of MRL/lpr mice was also differentially influenced by 3-PEHPC and rapamycin. The production of IFN-γ and IL17A, but not of IL-10, was reduced by rapamycin in accordance with a dominant role of mTOR in Th1 and Th17 T-cell development.39 By contrast, 3-PEHPC failed to influence IFN-γ and IL17A, but reduced levels of IL-10 that have been widely implicated in pathogenesis of human lupus.40–42 The diminished production of IL-10 may be related to the impact of 3-PEHPC on non-T cells, such as B cells and macrophages. Although 3-PEHPC inhibited the membrane partitioning of HRES-1/Rab4 and Rab5, it may likely influence other Rab GTPases. Therefore, further investigations into the role of HRES-1/Rab4 in lupus pathogenesis appear warranted in genetically altered animals.
In summary, our findings provide evidence for a role of HRES-1/Rab4-mediated Drp1 depletion in altered mitochondrial homeostasis in both SLE patients and lupus-prone mice. Rab geranylgeranyl transferase blockade with 3-PEHPC reversed the depletion of Drp1, accumulation of mitochondria, ANA production and nephritis in lupus-prone mice, identifying the regulation of mitochondrial homeostasis by HRES-1/Rab4 as a mechanism of pathogenesis and potential target for treatment in SLE.
Acknowledgments
This work was supported in part by grants AI048079 and AI072648 from the National Institutes of Health, the Alliance for Lupus Research, and the Central New York Community Foundation. The authors thank Dr Frank Ebetino for providing 3-PEHPC, Drs Katsuyoshi Mihara and David Chan for providing Drp1-deficient mouse embryonic fibroblasts, and Dr Paul Phillips for encouragement and support.
References
Supplementary materials
Supplementary Data
This web only file has been produced by the BMJ Publishing Group from an electronic file supplied by the author(s) and has not been edited for content.
Files in this Data Supplement:
- Data supplement 1 - Online supplement 1
Footnotes
-
Handling editor Tore K Kvien
-
Contributors All authors meet contributorship requirements.
-
Funding National Institutes of Health, the Alliance for Lupus Research, and the Central New York Community Foundation.
-
Competing interests None.
-
Ethics approval SUNY IRB.
-
Provenance and peer review Not commissioned; externally peer reviewed.