Article Text

Abstract
Objective To determine serum biomarker associations with clinical response to golimumab treatment in patients with psoriatic arthritis (PsA).
Methods GO–REVEAL was a randomised, placebo-controlled study of golimumab in patients with active PsA. Samples were collected from 100 patients at baseline, week 4 and week 14, and analysed for serum-based biomarkers and protein profiling (total 92 markers); data were correlated with clinical measures at week 14.
Results Serum levels of a subset of proteins (apolipoprotein C III, ENRAGE, IL-16, myeloperoxidase, vascular endothelial growth factor, pyridinoline, matrix metalloproteinase 3, C-reactive protein (CRP), carcinoembryonic antigen, intercellular adhesion molecule 1 and macrophage inflammatory protein 1α) at baseline or week 4 were strongly associated with American College of Rheumatology 20% improvement (ACR20) response and/or disease activity score in 28 joints (DAS28) at week 14. A smaller subset of proteins was significantly associated with a 75% improvement in the psoriasis area and severity index score (PASI75) at week 14, (adiponectin, apolipoprotein CIII, serum glutamic oxaloacetic transaminase, and tumour necrosis factor α). Subsets of proteins were identified as potentially predictive of clinical response for each of the clinical measures, and the power of these biomarker panels to predict clinical response to golimumab treatment was stronger than for CRP alone.
Conclusions This analysis provides insight into several panels of markers that may have utility in identifying PsA patients likely to have ACR20, DAS28, or PASI75 responses following golimumab treatment.
- Psoriatic Arthritis
- Anti-TNF
- TNF-alpha
This is an open-access article distributed under the terms of the Creative Commons Attribution Non-commercial License, which permits use, distribution, and reproduction in any medium, provided the original work is properly cited, the use is non commercial and is otherwise in compliance with the license. See: http://creativecommons.org/licenses/by-nc/3.0/ and http://creativecommons.org/licenses/by-nc/3.0/legalcode
Statistics from Altmetric.com
Introduction
Psoriatic arthritis (PsA) is a chronic, inflammatory joint disease involving synovial tissue, enthesitis and skin,1 and is associated with elevated serum and tissue levels of markers of inflammation and bone metabolism. Some pro-inflammatory cytokines including interleukin (IL)-1, IL-6, IL-15, IL-18 and tumour necrosis factor-like weak inducer of apoptosis (TWEAK)2 have been reported to be abundantly expressed in the synovium of PsA patients.3 ,4 Serum levels of TWEAK were shown to correlate with matrix metalloproteinase (MMP)-3 and disease activity score in 28 joints (DAS28) using the C reactive protein (CRP) level scores in patients with PsA.5 ,6 Serum MMP-3 levels have been modulated following anti-tumour necrosis factor (TNF)α therapy in PsA.7 Markers of inflammation such as CRP correlated with markers of bone remodelling (C-telopeptide of type I collagen (CTX-1) and deoxypyridinoline (DPD))8 in PsA, and macrophage colony-stimulating factor and receptor activator of nuclear factor κβ ligand (RANKL) have also been correlated with radiographic progression and joint space narrowing.9 These data suggest that both inflammatory and bone remodelling processes are activated in patients with active PsA.
We recently assessed the safety and efficacy of golimumab treatment (a human monoclonal antibody to TNFα) in a phase III study of active PsA.10 We sought to identify biomarkers associated with clinical progression or therapeutic response in skin and articular compartments. We analysed approximately 100 different serum proteins using multiplex and single-plex assay platforms (ELISA and Luminex) to identify markers modulated by golimumab treatment in patients with active PsA. Comparisons of baseline markers, along with change from baseline to week 4, were evaluated against several clinical response measures including the American College of Rheumatology 20% improvement (ACR20) response, DAS28 and 75% improvement in the psoriasis area and severity index score (PASI75), which assesses response of skin lesions, with the intent to understand the relationships between the markers and specific aspects of PsA.
Materials and methods
The primary results of the GO–REVEAL trial have previously been published.9 Briefly, adult patients with active PsA, despite previous therapy with disease-modifying antirheumatic drugs or non-steroidal anti-inflammatory drugs, were enrolled in this study. Patients were assigned in a ratio of 1 : 1.3 : 1.3 to receive subcutaneous injections of placebo (n=113), golimumab 50 mg (n=146), or golimumab 100 mg (n=146) every 4 weeks through week 20. For this analysis, the golimumab groups were combined into a single group and compared against the placebo group. The primary endpoint was the proportion of patients with ACR20 response at week 14, DAS28 using CRP- see primary paper and PASI75 were secondary endpoints.10
In this prospectively planned GO–REVEAL biomarker substudy, analyses were conducted for the first 100 patients, at selected study sites, who had sera obtained at weeks 0, 4 and 14.
The evaluated markers were chosen based on biomarker publications in PsA and previous experience in TNF-mediated autoimmune diseases including rheumatoid arthritis (RA) and PsA. Specific individual markers were chosen as well as a Rules Based Medicine Human MAP panel of markers and all assays met a variety of assay validation criteria. Serum was collected by standard methods and frozen at −70°C at the site before shipment to the central and speciality laboratories for batched testing. Samples were tested by Quintiles Laboratories (Marietta, Georgia, USA), Pacific Biomarkers (Seattle, Washington, USA) and Rules Based Medicine (Austin, Texas, USA); data were sent to Elashoff Consulting (Redwood City, California, USA) for statistical analysis. All 92 biomarkers had an established lower limit of quantification and met specified data inclusion criteria (eg, ≥20% of all samples for a given marker had to be above the lower limit of quantification for that assay). Biomarkers that were undetectable at baseline were excluded from subsequent data analyses. Robust linear regression models were used to test for the association of combined biomarker panels with multiple clinical endpoints. To account for multiple statistical testing, a false discovery rate (FDR) analysis was performed. The FDR analysis was used to define a p value threshold at which the FDR would be approximately 5–10%, and accounts for the fact that the biomarkers studied were not independent as demonstrated by marker-to-marker correlations. Prediction models were developed using logistic regression methods. The criteria for inclusion of data and statistical analysis methods were recently described in two similar golimumab biomarker studies.11 ,12
Results
Of the 92 analytes, 30 markers were not detectable at baseline and 62 met the criterion for inclusion and were analysed further. Overall, baseline biomarker levels were similar between the placebo and golimumab treatment groups and only four markers (brain-derived neurotrophic factor, insulin, TNF RII and intercellular adhesion molecule (ICAM)-1) were significantly different between the placebo and golimumab treatment groups at baseline (data not shown).
Baseline demographics
Biomarker changes over time
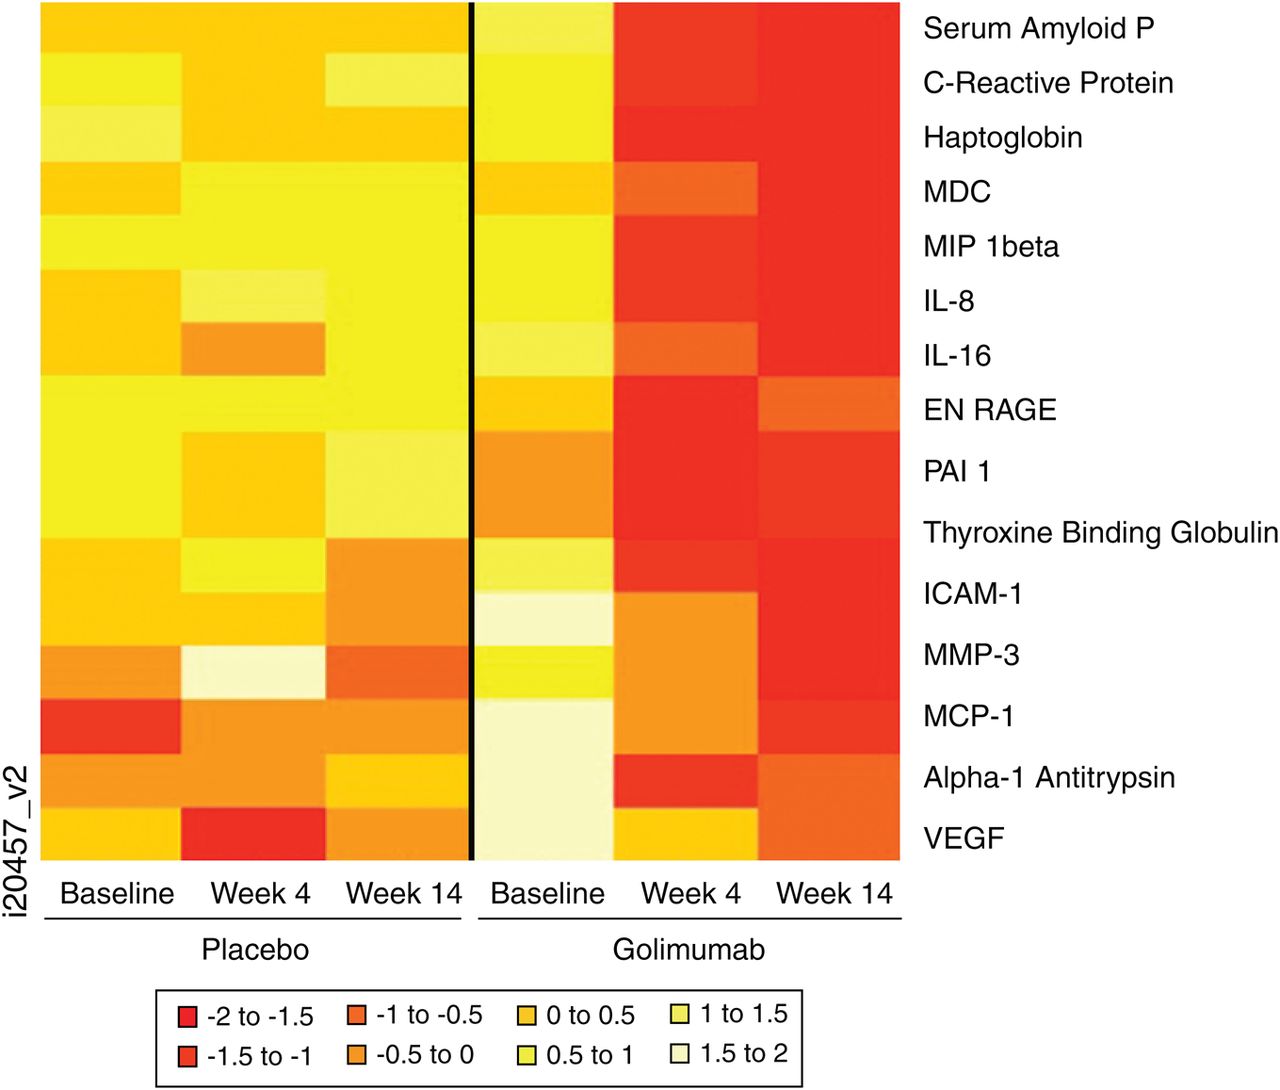
In the golimumab-treated group, multiple markers showed significant change from baseline to week 4. Figure 1 shows a heat map representation of markers in which the mean change from baseline at weeks 4 or 14 was significantly different between the two treatment groups. In general, golimumab treatment decreased levels of many biomarkers from baseline to week 14, with stable or slightly increasing levels of markers in the placebo group. In golimumab-treated patients, the levels of acute phase reactants (serum amyloid P, haptoglobin, α 1 antitrypsin), inflammatory markers (monocyte/macrophage derived chemokine, macrophage inflammatory protein (MIP)-1β, IL-8, IL-16, ENRAGE (also known as S100A12), ICAM-1, MMP-3, Monocyte chemotactic protein-1 (MCP-1), vascular endothelial growth factor (VEGF)), and other proteins (PAI-1, thyroxine binding globulin) were significantly decreased at weeks 4 and 14 compared with placebo-treated patients. Golimumab treatment also improved CRP levels relative to placebo. In contrast, less pronounced changes were observed in the placebo group.

Heat map profile of serum markers in which the changes at week 4 or 14 were significantly different in patients treated with golimumab versus placebo. IL, interleukin; ICAM, intercellular adhesion molecule; MCP, monocyte chemotactic protein-1; MDC, macrophage-derived chemokine; MIP, macrophage inflammatory protein; MMP, matrix metalloproteinase; PAI-1; plasminogen activator inhibitor 1; VEGF, vascular endothelial growth factor.
Comparison of clinical endpoints between placebo and combined golimumab groups in the biomarker substudy
In the biomarker substudy, 6.5% of patients in the placebo group achieved ACR20 response at week 14, compared with 55.1% of patients in the combined golimumab group. In addition, a higher percentage (48.0%) of patients in the combined golimumab group achieved a PASI75 response at week 14 compared with patients in the placebo group (9.5%). Likewise, there was a greater decrease in the mean DAS score in the combined golimumab group compared with those in the placebo group, −1.47 and −0.11, respectively. Comparison of the substudy with the overall study population indicated comparable clinical benefit following golimumab treatment in each of these efficacy measures.10
Biomarker correlations with clinical endpoints
The biomarkers (baseline levels and change from baseline to week 4) were evaluated for association with ACR20, DAS28, and PASI75 at week 14 using a logistic regression analysis (table 2). Only biomarkers with a significant association to at least one of the clinical measures are shown. Baseline levels of adiponectin, prostatic acid phosphate (PAP) and VEGF were significantly associated with two clinical endpoints, while no markers were significantly associated with all three measures. As shown in table 2, various other baseline markers were significantly associated with only one clinical measure. Interestingly, most of the identified markers were associated with DAS28, and relatively few correlated with ACR20 or PASI75.
Odds Ratios (OR) from robust logistic regression analysis testing the association between biomarker levels (baseline and changes from baseline to week 4) and clinical endpoints with at least one significant association at week 14 in the golimumab group
Biomarker changes from baseline to week 4 were also correlated with clinical measures at week 14. A similar pattern was observed, there were more associations with DAS28 than with ACR20 or PASI75, and none of the markers correlated across all three endpoints. Only the change in cancer antigen 125, IL-16, PAP and serum glutamic oxaloacetic transaminase (SGOT) levels correlated with two clinical endpoints, although other analytes correlated with a single endpoint. ENRAGE, IL-16, myeloperoxidase, PAP and VEGF consistently correlated with ACR20 and/or DAS28 endpoints, with both baseline and change from baseline to week 4 biomarker results.
The placebo group had no significant associations between biomarkers and any clinical endpoints except for a correlation between change from baseline to week 4 in MIP-1β with DAS28 at week 14 (data not shown).
Biomarker prediction of clinical endpoints
Combined baseline biomarker panels were evaluated for their potential to predict clinical response at week 14 using a logistic regression model (table 3). Pyridinoline, adiponectin, PAP and factor VII were identified as a panel of markers that have the potential to be predictive of ACR20 response at week 14 (specificity 65%, sensitivity 85%). Similarly, adiponectin, factor VII, SGOT, IgA and leptin were identified as potentially predictive of DAS28 response (specificity 71%, sensitivity 90%). Adiponectin, factor VII and IL-16 indicated prediction of PASI75 response (specificity 63%, sensitivity 76%). Both adiponectin and factor VII appeared in the prediction models for all three clinical endpoints.
Logistic regression model comparing baseline CRP and baseline combined biomarker panels in predicting clinical response to golimumab treatment at week 14
The data for CRP as a single analyte are shown for comparison to the biomarker panels as well as to the individual markers identified in the predictive panels for ACR20, DAS28 and PASI75 at week 14. The predictive power of the biomarker panels was stronger than for CRP alone for each of the endpoints.
Discussion
This biomarker substudy of GO–REVEAL showed that golimumab treatment is effective in modulating specific acute-phase reactants, inflammatory markers, metabolic factors, bone remodelling markers and other selected proteins compared with placebo. Due to the varied assessments used to measure improvement in PsA, it is not surprising that no individual marker significantly correlated with all three clinical measures. However, as shown in table 2, the odds ratios (OR) for several of the identified markers showed strong associations with two of the clinical measures (DAS28 and ACR20) at week 14.
In the current study, serum levels of a subset of proteins (apolipoprotein CIII, ENRAGE (S100A12), IL-16, myeloperoxidase, VEGF, pyridinoline, MMP-3, CRP, carcinoembryonic antigen, ICAM-1 and MIP-1α) at baseline or week 4 were strongly associated with ACR20 and/or DAS28 scores at week 14. Several of these markers including CRP, VEGF, MMP-3 and ICAM-1 have been previously identified to correlate with clinical endpoints in RA following anti-TNF treatment,12 suggesting biological similarities in some disease processes, especially among PsA patients with polyarticular peripheral arthritis. In a recent study, levels of IL-6, VEGF, MMP-3 and YKL-40 were significantly associated with clinical response to anti-TNFα therapies in patients with spondyloarthropathies.13 In RA, high baseline levels of urinary pyridinoline/DPD ratio are predictive of joint damage and are thought to reflect alterations in the bone tissue matrix, and these markers might also have significance in PsA.14 ,15
A few markers at baseline were significantly associated with PASI75 at week 14 including adiponectin, apolipoprotein CIII, SGOT and TNFα. In addition, both IL-16 and ENRAGE(S100A12) levels were strongly associated with DAS28 and/or ACR20 at week 14 in golimumab-treated PsA patients. Several of these markers have been identified to be of particular interest. IL-16 has been shown to be induced in synovial fibroblasts from RA patients, independent of nuclear factor κB signalling.16 In addition, IL-17 can increase levels of IL-16 messenger RNA by RA fibroblast-like synoviocytes and peripheral blood mononuclear cells.17 Given the proposed role of IL-17 in spondylarthropathies,18 it is possible that there is a synergy with IL-16 and IL-17 to perpetuate rheumatological disease processes. Elevated levels of ENRAGE (S100A12) have been observed in both tissue and peripheral blood of PsA patients and can be modulated by treatment with methotrexate.19 The associations observed with adiponectin are intriguing relative to the effect of obesity on clinical outcomes and response to therapy in several systemic inflammatory autoimmune conditions, including PsA. In RA, adiponectin levels correlate with disease severity.20 Also, coordinated roles for adiponectin, leptin and visfatin are suggested in the modulation of the inflammatory environment in patients with RA.21 It could be that these adipokines play a similar role in PsA and can be downregulated by TNF inhibition. Nevertheless, the available data regarding the effects of anti-TNF treatments on adiponectin levels in RA are often conflicting.
We also explored whether CRP alone or in a combination of markers could significantly predict clinical response to golimumab treatment in patients with PsA. In combination with other markers, CRP did not improve the prediction of clinical response over the biomarker panels identified without CRP. Different combinations of markers including, pyridinoline, adiponectin, PAP, factor VII, IL-16, SGOT, IgA and/or leptin were found to be predictive of ACR20, DAS28, or PASI75 response to golimumab treatment. Baseline levels of adiponectin and factor VII with other markers were significantly associated with all three evaluated clinical measures. The only markers indentified as potential predictive markers for PASI75 response at week 14 were IL-16, adiponectin and factor VII. The sensitivity and specificity of these combinations were stronger than CRP alone in predicting clinical response.
This analysis identified several panels of markers that may be predictive of ACR20, DAS28, or PASI75 responses. The goal of including this broad panel of markers was to evaluate potential new markers not previously known for their associations with PsA disease or TNF-mediated disease processes. Although these analyses included nearly 100 markers for comparison with clinical efficacy measures, there may well be other analytes that could show even stronger correlations, including some that indicate disease healing or repair. It is not surprising that different panels of markers were identified given the unique information captured in these clinical assessments evaluating either skin or joint involvement. As this was a hypothesis-generating evaluation of a panel of markers that may be predictive, it is recognised that these observations would need to be confirmed in an independent study. However, these results can provide a valuable foundation for subsequent biomarker comparisons in the PsA population. Insights from this study have suggested new combinations of markers that may have utility in understanding the relevance of changes in the inflammatory processes that occur in the skin and joints of PsA patients in response to golimumab treatment.
Acknowledgments
The authors thank the patients, investigators and study personnel who made the GO–REVEAL study possible. The authors also thank Mary Whitman, PhD, and Kirsten Schuck of Janssen Services, LLC. for writing and editing support.
References
Footnotes
-
Funding This study was supported by Janssen Research & Development, LLC, Spring House, PA, USA and Merck/Schering-Plough, Kenilworth, NJ, USA.
-
Competing interests ME served as a paid consultant for the study sponsor. IBMI has received grant support and honoraria from MSD. PJM has received grant support, consulting fees, and/or speaker fees from Janssen, Abbott, Amgen, BMS, Pfizer, Lilly, Genentech, Roche, BiogenIdec, Novartis and UCB. GGK has received fees as a consultant or advisory board member for Abbott, Amgen, Anacor, ApoPharma, Astellas, Boehinger Ingelheim, Bristol Meyers Squibb, Janssen, CombinatoRx, Genetech, Genzyme, Idera, Isis, Lilly, L'Oreal, MedaCorp, Medicis, Novartis, NovoNorodisk, Pfizer, Schering Plough, Somagenics, Synvista, Vascular Biologics Ltd and UCB. In the past 24 months,GGK has received lecture fees from Abbott, Amgen, Astellas, Janssen, National Psoriasis Foundation and the Foundation for Better Health Care. GGK has received partial stipend support for a clinical research fellowship from Abbott, Amgen and Janssen. KP has served as a consultant for Abbott, Amgen, Astellas, Celgene, Eli Lilly, Janssen, Janssen Biotech, Johnson & Johnson, Merck, Novartis, Pfizer and UCB. KP has been on speaker's bureaus for Amgen, Astellas, Janssen, Merck, Novartis and Pfizer. KP has received clinical research grants from Abbott, Amgen, Anacor, Astellas, Celgene, Celtic, Dow Pharma, Eli Lilly, Galderma, Janssen, Janssen Biotech, Merck and Novartis. He has served on advisory boards for Abbott, Amgen, Celgene, Janssen, Janssen Biotech, Merck, Novartis and Pfizer. JJGR is on the advisory boards of BMS, Pfizer, Roche, Schering-Plough and UCB SA, has received lecture fees from BMS, Roche, Schering-Plough and Wyeth, and has received research grants from Roche and Schering-Plough. CW, SV, MM and AB were all employees of Janssen Research & Development, LLC at the time of the study and own stock/stock options in Johnson & Johnson. DDG has received research support from Abbott, Amgen, BMS, Janssen, Pfizer and UCB. AK has received consultancies, speaking fees and/or honoraria from Janssen. FTM has no conflicts of interest.
-
Ethics approval Institutional review board or ethics committee approval and patient written informed consent were obtained before study participation.
-
Provenance and peer review Not commissioned; externally peer reviewed.
-
Open Access This is an Open Access article distributed in accordance with the Creative Commons Attribution Non Commercial (CC BY-NC 3.0) license, which permits others to distribute, remix, adapt, build upon this work non-commercially, and license their derivative works on different terms, provided the original work is properly cited and the use is non-commercial. See: http://creativecommons.org/licenses/by-nc/3.0/