Article Text

Abstract
Background: Magnetic resonance imaging (MRI) of sacroiliac joints has evolved as the most relevant imaging modality for diagnosis and classification of early axial spondyloarthritis (SpA) including early ankylosing spondylitis.
Objectives: To identify and describe MRI findings in sacroiliitis and to reach consensus on which MRI findings are essential for the definition of sacroiliitis.
Methods: Ten doctors (two radiologists and eight rheumatologists) from the ASAS/OMERACT MRI working group reviewed and discussed in three workshops MR images depicting sacroiliitis associated with SpA and other conditions which may mimic SpA. Descriptions of the pathological findings and technical requirements for the appropriate acquisition were formulated. In a consensual approach MRI findings considered to be essential for sacroiliitis were defined.
Results: Active inflammatory lesions such as bone marrow oedema (BMO)/osteitis, synovitis, enthesitis and capsulitis associated with SpA can be detected by MRI. Among these, the clear presence of BMO/osteitis was considered essential for defining active sacroiliitis. Structural damage lesions such as sclerosis, erosions, fat deposition and ankylosis can also be detected by MRI. At present, however, the exact place of structural damage lesions for diagnosis and classification is less clear, particularly if these findings are minor. The ASAS group formally approved these proposals by voting at the annual assembly.
Conclusions: For the first time, MRI findings relevant for sacroiliitis have been defined by consensus by a group of rheumatologists and radiologists. These definitions should help in applying correctly the imaging feature “active sacroiliitis by MRI” in the new ASAS classification criteria for axial SpA.
Statistics from Altmetric.com
Imaging of the sacroiliac (SI) joints and the spine has an important role in diagnosing, classifying and monitoring ankylosing spondylitis (AS) and other spondyloarthritides (SpA). Traditionally, conventional radiographs have been and are still being used to depict structural changes associated with AS such as sacroiliitis of the SI joints. For diagnosis of AS, radiographic sacroiliitis has been regarded as crucial for a long time. Since the 1930s it has been known that AS starts in the great majority of patients in the SI joints and that the SI joint is nearly always affected in patients with AS.1 Consequently, radiographic sacroiliitis became part of the Rome criteria in 19612 and an essential part of the modified New York criteria in 1984.3 The latter are still in use. In the 1980s, computed tomography (CT) of the SI joints was shown to more accurately depict radiographic sacroiliitis than plain radiographs.4 However, both plain radiographs and CT have major limitations because they detect only structural damage of the joints, which is regarded as the consequence of inflammation, and cannot visualise active inflammation itself. It might indeed take several years of continuous or fluctuating activity before structural damage can be seen by x-ray examination.5 6
Since the early 1990s magnetic resonance imaging (MRI) has been increasingly used to visualise inflammation in the SI joints7 and in the spine. It has become clear over recent years that active inflammatory lesions are visible on MRI long before definite lesions on plain radiographs are detectable.8 In patients with normal or equivocal SI joints on plain radiographs but active sacroiliitis on MRI, definite radiographic sacroiliitis developed in a considerable proportion of patients after 3–7 years.6 9 Thus, it has been proposed that patients with axial spondyloarthritis, irrespective of the presence or absence of radiographic changes, should be considered as belonging to one disease continuum.8
To date, appropriate criteria for diagnosing or classifying patients with axial SpA without radiographic changes, referred to as non-radiographic axial SpA, have been lacking. None of the existing criteria for SpA—that is, the modified New York criteria,3 the European Spondylarthropathy Study Group criteria,10 or the Amor criteria11 contain MRI as an imaging parameter because all these criteria were developed in the pre-MRI era. Most recently, the “Assessment of SpondyloArthritis international Society” (ASAS) has developed new classification criteria for axial SpA including patients with radiographic and non-radiographic sacroiliitis, which have been presented in more detail elsewhere in this journal.12 Similar to previous criteria, sacroiliitis detected by imaging plays an important role in these new criteria. However, in the new ASAS criteria, imaging of the SI joints includes not only x-ray examinations but also MRI in order to be applicable also in early axial SpA.
The aims of this project of the ASAS/OMERACT MRI working group were as follows: (a) to describe MRI findings in sacroiliitis (active inflammatory lesions and structural damage lesions) associated with SpA and formulate definitions for these findings; further, to provide representative MR images as examples of the various findings and point out and illustrate pitfalls and differential diagnoses; (b) to reach consensus within a group of rheumatologists and radiologists experienced in both SpA and MRI on which MRI finding(s) should be considered as sufficient for making an imaging diagnosis of sacroiliitis compatible with AS/SpA by MRI, particularly with respect to the new classification criteria for axial SpA.12
Methods
Rheumatologists and radiologists of the ASAS/OMERACT MRI group with interest and experience in both SpA and MRI were invited to participate in this consensus exercise. Ten people (two radiologists, eight rheumatologists) participated. The work presented herein focuses on the SI joints only. In three workshop meetings, numerous MR images of the SI joints from patients with and without sacroiliitis, representing the entire spectrum of possible findings, were reviewed and discussed by the group. As a result, technical requirements for appropriate MR imaging of the SI joints were formulated and various pathological findings in relation to the anatomical structures were defined. Thereafter, the findings which are required to define the presence of sacroiliitis associated with SpA on MRI for diagnostic and classification purposes were agreed on by consensus.
Results
Active inflammatory lesions of the SI joints
Technical aspects
Active inflammatory lesions can be visualised with both short τ inversion recovery (STIR) images and T1 with or without additional fat suppression (FS) after administration of intravenous gadolinium (T1 with or without FS post-Gd) sequences. Caution is warranted with the use of gadolinium in patients with impaired renal function. In general, STIR sequences are usually sufficient to detect bone marrow oedema (BMO) reflecting active (acute) inflammatory lesions; synovitis of the SI joints, capsulitis and also enthesitis are more reliably detected on T1 post-IV gadolinium sequences.13 14 A typical STIR sequence with a 1–1.5 T superconducting whole-body magnet using a body phased-array coil consists of the following parameters: TR/TE/TI: 4000/60/150 ms, slice thickness 3 or 4 mm. The respective parameters for a typical T1 sequence are: TR/TE: 500/10 ms and for a T1 with fat suppression (T1 FS): TR/TE: 660/16.
In general, on T1 sequences fat tissue gives a bright (hyperintense) signal and water a dark signal (hypointense), whereas on STIR sequences water gives a bright signal and fat tissue a normo-intense or hypointense signal (as compared with the signal from normal bone as reference value).
The orientation of most MRI sequences is semicoronal planes (parallel to a line joining the upper dorsal aspect of S1 and S3), which is the standard in most institutes. Additional sequences in semiaxial planes (not standard in most institutes) which are oriented perpendicularly to semicoronal planes, can provide additional information.15
Descriptions of active inflammatory lesions
Active inflammation of the SI joints attributable to SpA can be visualised as (a) BMO/osteitis; (b) synovitis of SI joints; (c) enthesitis or (d) capsulitis.
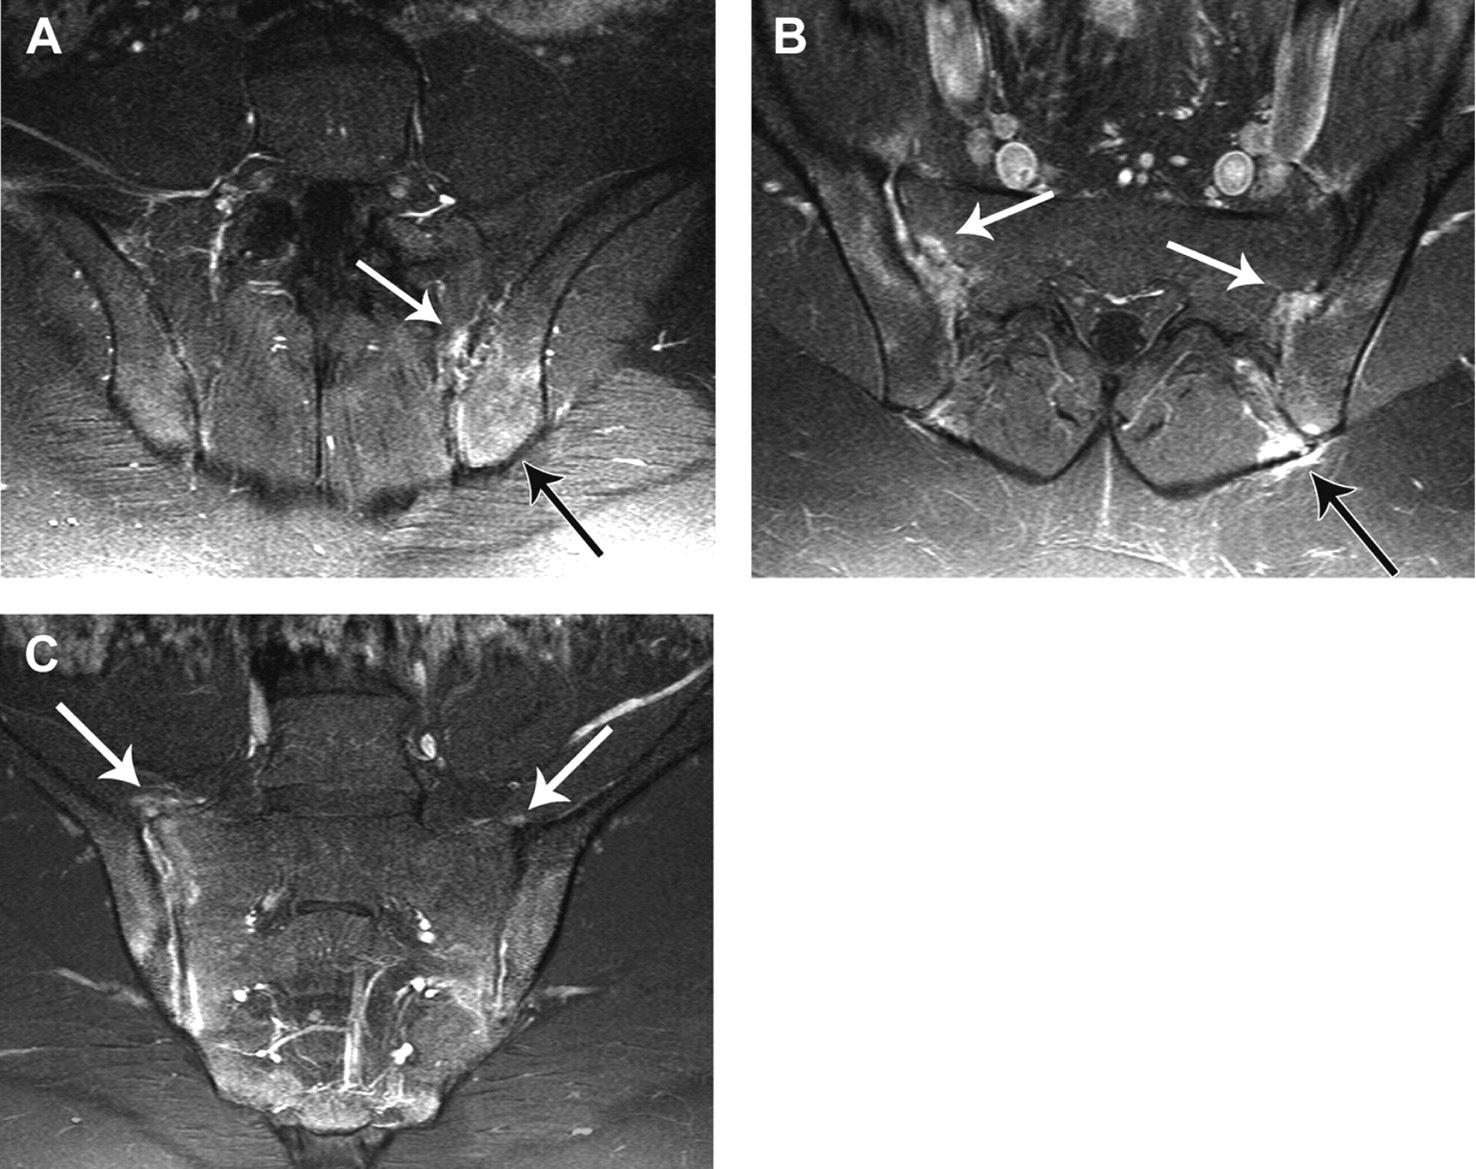
Bone marrow oedema/osteitis (fig 1)
BMO is depicted as a hyperintense signal on STIR images and usually as a hypointense signal on T1 images. The more intense the signal the more likely that it reflects active inflammation. A strong hyperintense signal is similar to that of blood vessels or spinal fluid. A hyperintense signal on contrast-enhanced, T1-weighted, fat-saturated images (T1 post-Gd) reflects increased vascularisation and is referred to as osteitis. The sacral interforaminal bone marrow signal forms the reference for assignment of normal signal in the bone.16
BMO/osteitis is an indicator of active sacroiliitis but may be found in other diseases as well.
Affected bone marrow areas are typically located periarticularly (subchondral bone marrow).
BMO may be associated with signs of structural damage such as sclerosis or erosions.
Synovitis (fig 2)
STIR sequences do not differentiate between synovitis and physiological joint fluid. Thus, synovitis is best detected as a hyperintense signal on contrast-enhanced, T1-weighted, fat-saturated images in the synovial part of the SI joints (intensity similar to blood vessels).
Synovitis on MRI as a single feature (without BMO) is very rare and does not suffice for making a diagnosis of sacroiliitis for classification purposes.
Enthesitis (fig 3A and B)
Enthesitis is depicted as a hyperintense signal on STIR images and/or on contrast-enhanced, T1-weighted, fat-saturated images at sites where ligaments and tendons attach to bone, including the retroarticular space (interosseous ligaments). The signal may extend to bone marrow and soft tissue.
Capsulitis (fig 3C)
Capsulitis has similar signal characteristics to those of synovitis but these changes involve the anterior and posterior capsule. Anteriorly, the joint capsule gradually continues into the periosteum of the iliac and sacral bones and thus corresponds to an enthesis. Capsulitis may therefore extend far medially and laterally into the periosteum.
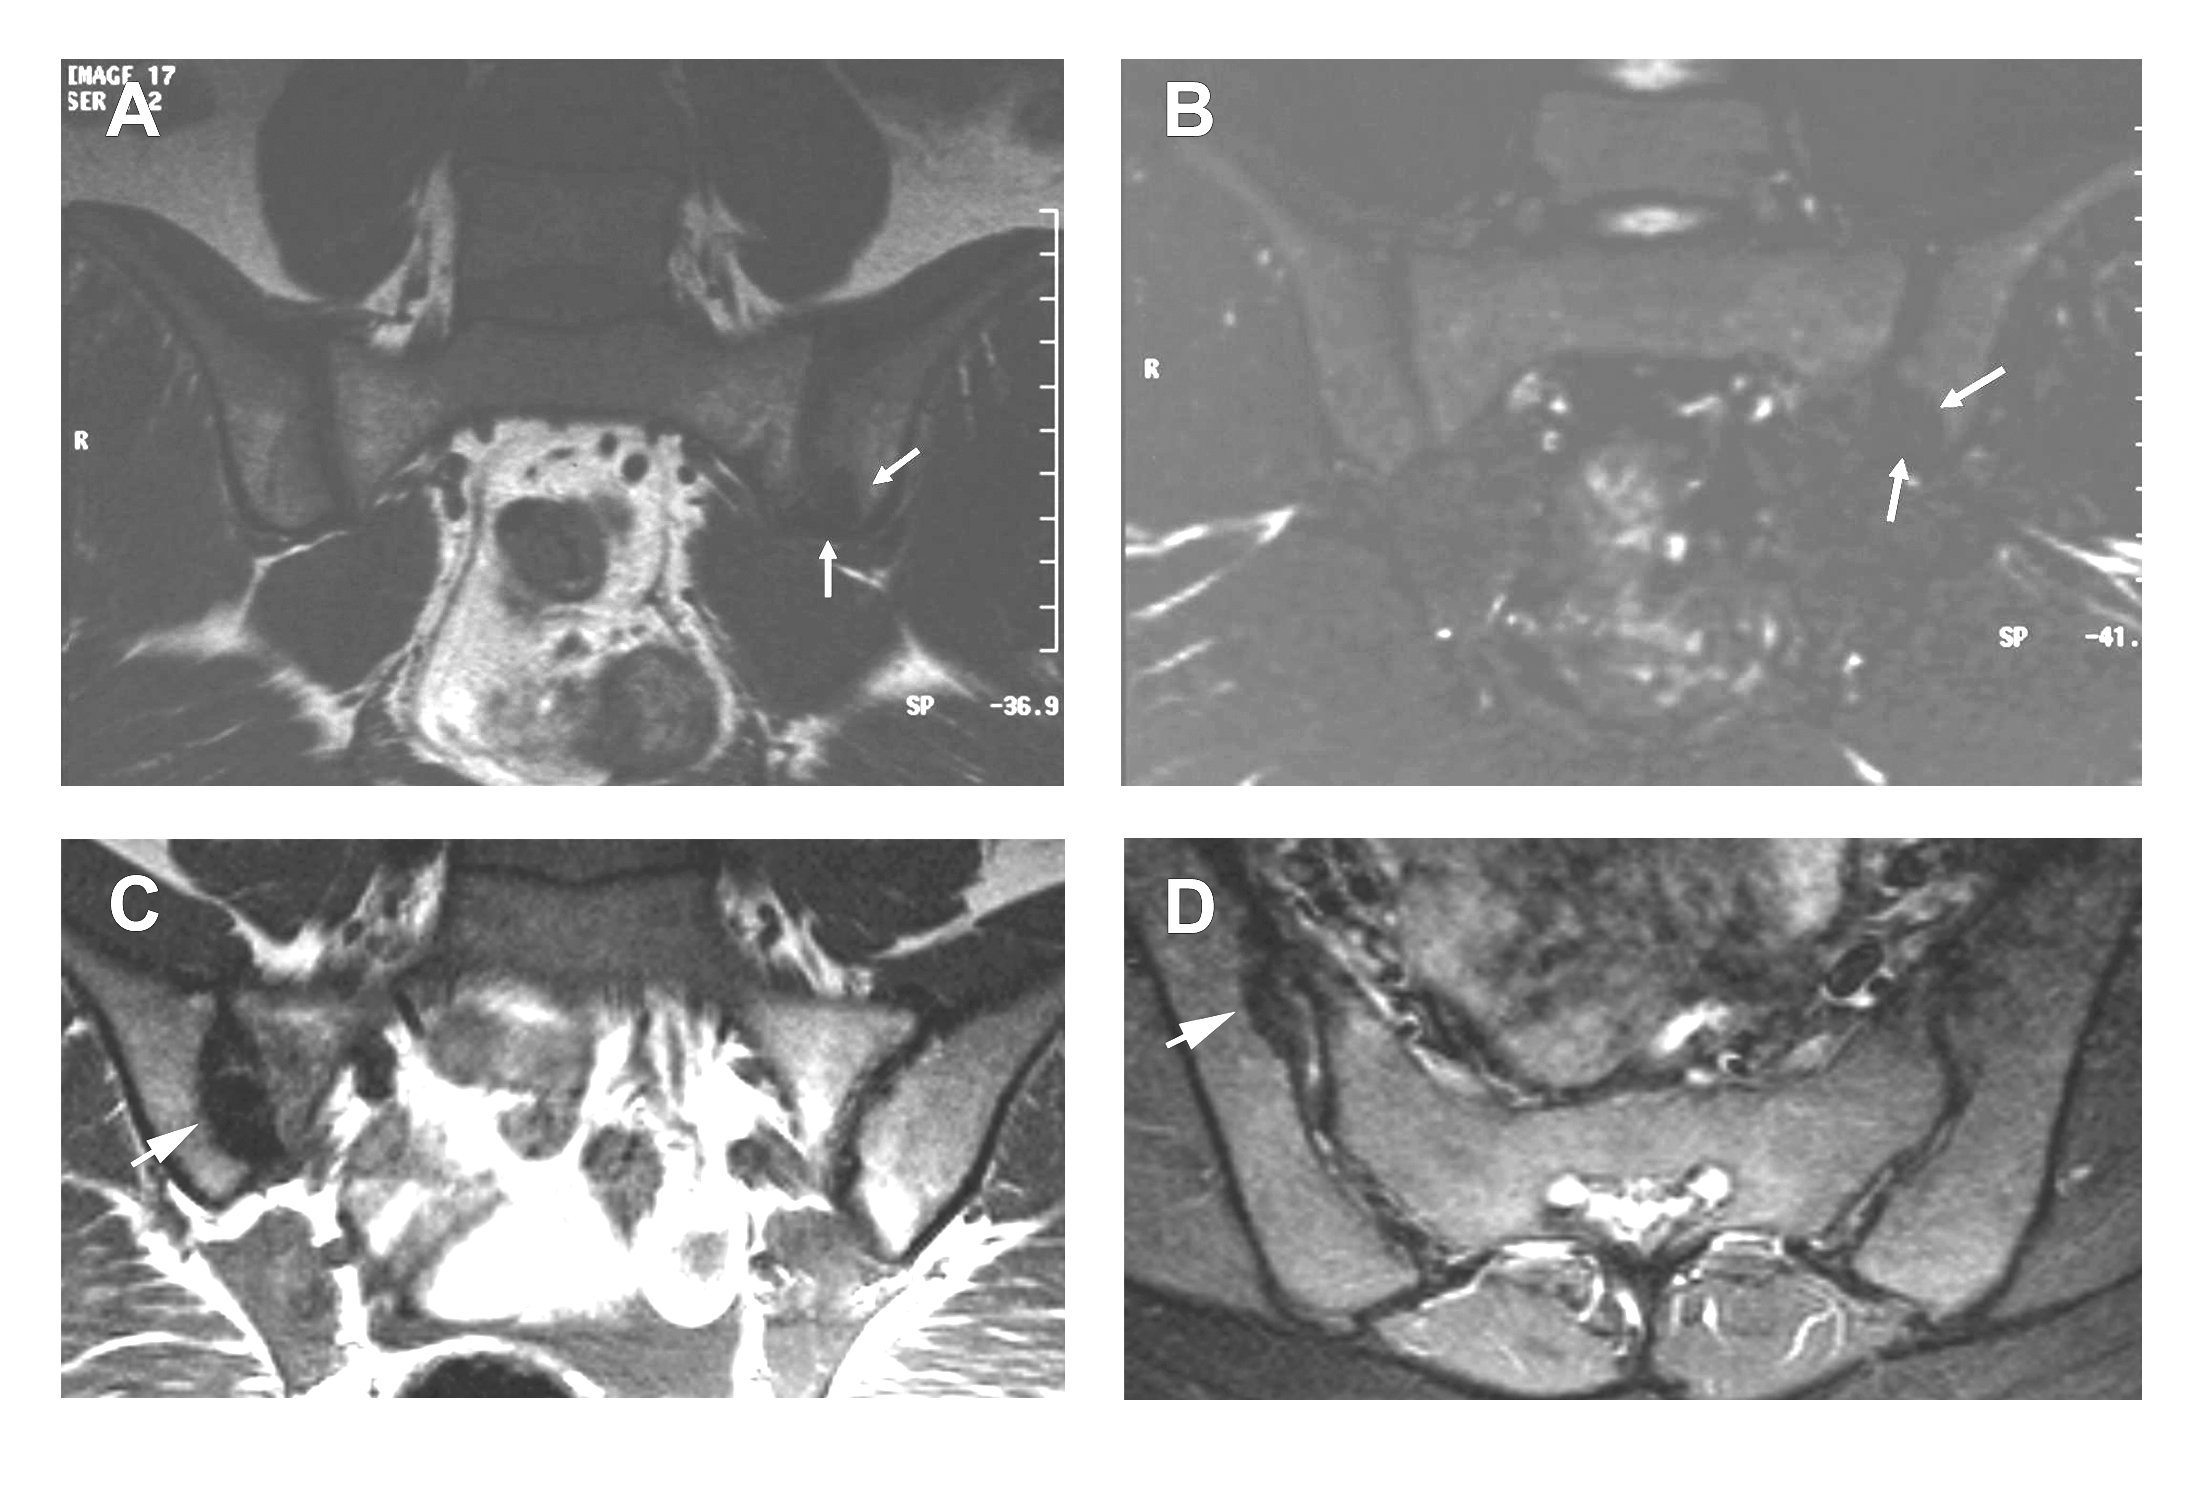
Other conditions associated with active inflammatory lesions (differential diagnoses) and pitfalls (figs 4 and 5)
A number of other pathological conditions may mimic the inflammatory lesions seen in SpA. It is important to realise that inflammation of SI joints attributable to SpA is usually limited to the bone/SI joint and does not cross anatomical borders. In contrast, inflammation due to infection (septic sacroiliitis) often crosses anatomical borders and spreads diffusely to soft tissues (figs 4A and B).17 Other diseases may result in reactive (secondary) lesions that appear as active BMO/osteitis on MRI such as insufficiency bone fractures (figs 4C and D), typically of the sacral bone, or, although rare, bone tumours such as osteosarcoma (supplementary fig 1). Osteoarthritis of SI joints, most often found in the elderly, may occasionally be associated with small areas of BMO along the SI joint (supplementary fig 2). Osteitis condensans ilii (osteitis triangularis) has quite a typical appearance not only on radiographs but also on MRI (supplementary fig 3). Ligaments surrounded by blood vessels may appear and erroneously be interpreted as actively inflamed on STIR sequences (fig 5C). The so called “coil effect” is a technical artefact that makes normal anatomical structures appear hyperintense. Using semicoronal sequences, the coil effect is typically seen at the lower part of the sacral bone and sometimes of the iliac bone and also affects the adjacent soft tissue (figs 5A and B).

Bone marrow oedema (BMO), reflecting active sacroiliitis. BMO appears as hyperintense signal on STIR sequence. The sacral interforaminal bone marrow signal forms the reference for assignment of normal signal in the bone. Affected bone marrow areas (arrows) are located subchondrally and periarticularly (A, C, D; STIR sequences). On T1 sequences (B, same patient as in A), BMO often appears as a hypointense signal. (D) BMO in the left iliac bone (white arrow; STIR sequence). Since only one signal is visible in this slice, the signal (BMO) should be visible in addition on at least one adjacent slice in order to fulfil the definition of active sacroiliitis (see also text).

Synovitis as an active inflammatory lesion appears as hyperintense signal on contrast-enhanced, T1-weighted, fat-saturated images in the synovial part of the sacroiliac (SI) joints (arrows in A); the signal intensity is similar to that of blood vessels). (B) STIR sequence; the signal intensity within the SI joint is less bright. (C) T1 sequence, for comparison.
Enthesitis and capsulitis. Enthesitis (white arrows in A and B) of interosseous ligaments on contrast-enhanced, T1-weighted, fat-saturated images: (A) semicoronal view, (B) semiaxial view. Osteitis of the left iliac bone (black arrow in A and B) is also present. (C) Capsulitis (arrows) is a hyperintense signal of the sacroiliac (SI) joint capsule. Anteriorly, the joint capsule gradually continues into the periosteum of the iliac and sacral bones. Capsulitis, therefore, may extend medially and laterally into the periosteum (contrast-enhanced T1-weighted fat-saturated image). Osteitis of the right SI joint (active sacroiliitis) is also seen in this patient.

Differential diagnoses of spondyloarthritis-related sacroiliitis: infection and fractures. (A and B) infectious (septic) sacroiliitis of the left sacroiliac (SI) joint. The bone marrow oedema (BMO) located in the left SI joint widely extends from bone to soft issue (white arrow), thus crossing anatomical borders (A, STIR sequence). The BMO as seen in (A) appears on a T1-weighted image (B) as a hypointense signal; same patient as in (A). (C and D) insufficiency fracture (arrows) of the left sacral bone. (C) STIR sequence: extensive BMO with a heterogeneous appearance is seen in large areas of the left sacral bone. (D) T1-weighted sequence showing hypointense signals of the left sacral bone; same patient as in (C).

Pitfalls in diagnosing bone marrow oedema (BMO). (A) Coil effect (white arrows) with false-positive (hyperintense) signals (white arrowhead) in the lower sacral part of the right sacroiliac (SI) joint (STIR sequence). (B) The false-positive signal is less strong by far in the contrast-enhanced, T1-weighted, fat-saturated image, therefore considered as an artefact. Note, however, that a strong signal in this anatomical area (lower part of the sacral bone) may occasionally indicate BMO related to enthesitis. (C) Blood vessel mimicking bone marrow oedema. A hyperintense signal due to a ligament surrounded by blood vessel (circle) in the left SI joint space is seen; STIR sequence. This hyperintense signal was visible on one slice only and not on consecutive slices and should not be misinterpreted as BMO.
Structural damage lesions
Technical aspects
T1-weighted sequences (TR/TE: 500/10 ms) are usually sufficient to detect structural lesions (sclerosis, fat deposition, ankylosis). T1-weighted sequences with fat saturation (T1 FS; TR/TE 660/16 ms) or T2-weighted gradient echo sequences (TR/TE 180/7.15 ms) may better visualise the cartilage of the SI joints and, therefore, might be more useful to detect erosions.
Definitions of structural damage lesions (MRI lesions reflecting previous inflammation of SI joints)
Structural damage lesions of the SI joints can appear as (a) subchondral sclerosis; (b) erosions; (c) fat deposition; (d) bony bridges/ankylosis.
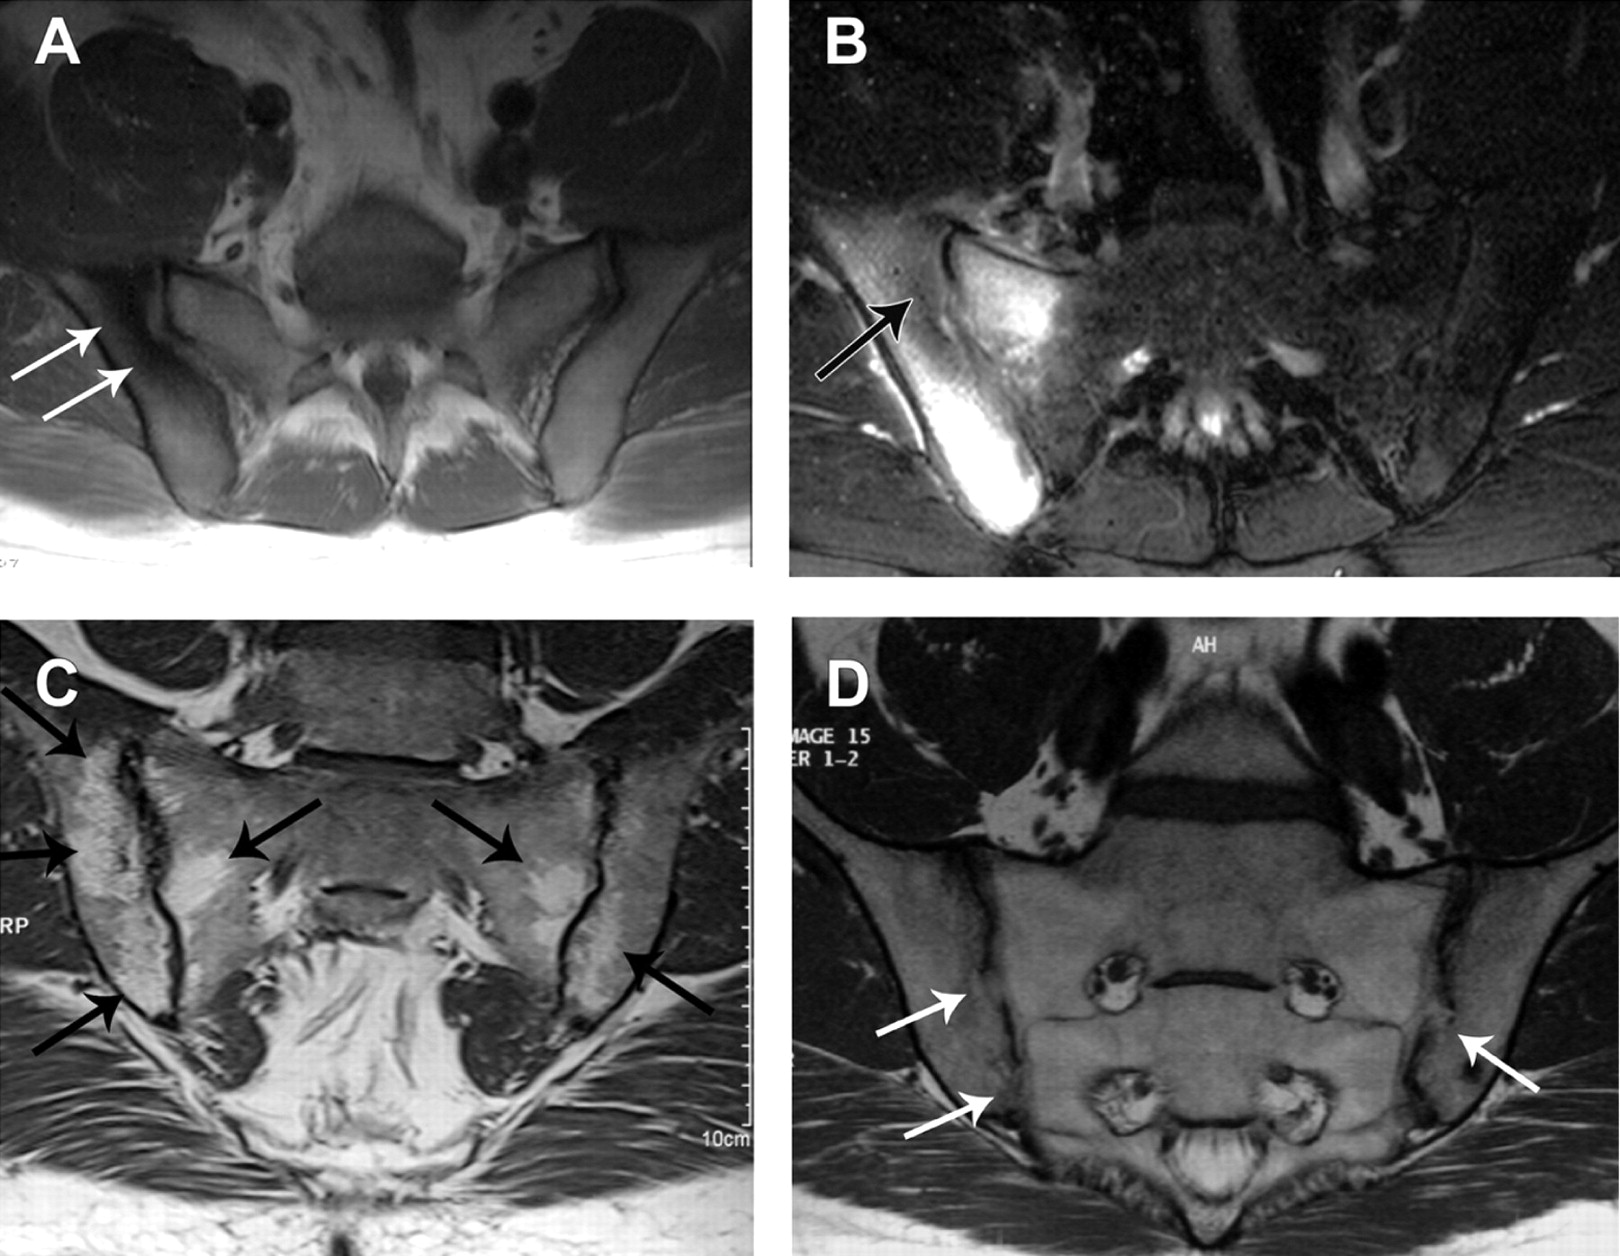
Subchondral sclerosis (figs 6A and B)
Sclerotic areas are depicted as low-intensity or signal-free bands by all sequences (T1, STIR, T1 post-Gd) and do not show signal enhancement after contrast medium administration.
Sclerosis attributable to SpA should extend at least 5 mm from the SI joint space since small areas of periarticular sclerosis can be observed in healthy subjects (physiological sclerosis).
Erosions (supplementary fig 4)
Erosions are of low signal intensity on T1-weighted images and high signal intensity on STIR images if active. T2-weighted gradient echo or T1 FS sequences maybe more useful in detecting erosions.
Erosions are bony defects at the joint margin. Erosions may occur throughout the cartilaginous compartment of the joint. Erosions initially appear as single lesions. Confluence of erosions may be seen as pseudo-widening of the SI joints.
Periarticular fat deposition (fig 6C)
Fat deposition is characterised on MRI by an increased signal on T1-weighted images.
Fat deposition results from the esterification of fatty acids in inflammatory, often periarticular bone marrow areas.18
In general, fat deposition is a non-specific finding. In SpA, it probably indicates areas of previous inflammation.
Bony bridges/ankylosis (fig 6D)
Bony bridges or ankylosis of the SI joint appears as a low-intensity signal on all MRI sequences, sometimes surrounded by high-intensity signal on T1 (fat deposition of bone marrow).
Bone buds directly facing each other can fuse to form bony bridges across the joint.
When several adjoining bony bridges are present, the joint cavity becomes increasingly blurred.
Definition of sacroiliitis on MRI
After presentation and discussion of numerous MR images depicting sacroiliitis in SpA but also other conditions the group agreed by consensus on a definition of sacroiliitis on MRI for application in the ASAS classification criteria (box 1).
Box 1: Definition of sacroiliitis on MRI (“positive MRI”)
Types of findings required for definition of sacroiliitis by MRI
Active inflammatory lesions of the sacroiliac joints (reflecting active sacroiliitis) are required for the fulfilment of the imaging criterion “sacroiliitis on MRI” as applied in the ASAS classification criteria for axial spondyloarthritis (SpA).
Bone marrow oedema (BMO) (on STIR) or osteitis (on T1 post-Gd) highly suggestive of SpA must be clearly present and located in the typical anatomical areas (subchondral or periarticular bone marrow).
The sole presence of other active inflammatory lesions such as synovitis, enthesitis or capsulitis without concomitant BMO/osteitis is not sufficient for the definition of sacroiliitis on MRI.
Structural lesions such as fat deposition, sclerosis, erosions or bony ankylosis are likely to reflect previous inflammation. At this moment, however, the consensus group felt that the sole presence of structural lesions without concomitant BMO/osteitis does not suffice for the definition of a positive MRI.
Amount of signal required
Discussion
The aim of this study was to define sacroiliitis on MRI, a so-called “positive MRI”, in the context of SpA. Sacroiliitis on MRI is one of the two imaging criteria in the new ASAS classification criteria for axial SpA, but to date no uniformly accepted definition of sacroiliitis on MRI is available. To accomplish this, a group of rheumatologists and radiologists (ASAS/OMERACT MRI working group) with interest in SpA and MRI first described the various findings associated with sacroiliitis on MRI and, thereafter, decided by consensus on the minimum requirements of MRI findings for considering sacroiliitis to be present. Accordingly, the presence of subchondral BMO/osteitis reflecting active inflammation of the SI joints was regarded as essential for the definition of sacroiliitis on MRI associated with SpA. The term “bone marrow oedema” reflects an increased water content (oedema) of the bone visible on STIR sequences while the term “osteitis” applies to bone areas with signal enhancement on T1-weighted images after administration of a contrast agent, reflecting increased perfusion due to inflammation. Of note, BMO/osteitis is an integral part of all published indices for the quantification of active inflammation of the SI joints,6 9 16 18 19 20 21 22 and change of BMO is assessed when scoring the effects of tumour necrosis factor blocker therapy.23 24
It has been shown before in patients with AS that BMO of the SI joint25 and the spine26 correlates with histological inflammation. Similar correlations between BMO on MRI and histological inflammation have been reported for finger joints from patients with rheumatoid arthritis.27 28 On the other hand, in osteoarthritis of the knee BMO on MRI occurred without a clear correlation with histological inflammation.29 Thus, BMO probably reflects inflammation in axial SpA, but BMO can also arise from mechanical stress. Moreover, BMO can occur in insufficiency fractures of the sacral bone (figs 4C and D) or in malignant tumours of the bone (supplementary fig 1), as well as in septic sacroiliitis (figs 4A and B); all of them are rare, though important differential diagnoses of sacroiliitis associated with SpA. These examples underline the need for experience in interpreting MRI of the SI joints and the importance of making a correct diagnosis in order to initiate appropriate treatment. The above-mentioned conditions can often, but not always, be differentiated from BMO associated with SpA. A specificity of about 90% for active inflammatory lesions of the SI joint on MRI for a diagnosis of SpA has recently been estimated,30 though few publications on the specificity of MRI are available. Further studies are needed to obtain a more accurate figure for the specificity.
The BMO associated with sacroiliitis in the context of SpA should be located subchondrally and periarticularly. At present it is not possible to give a more precise definition of the minimum size (area) of the BMO which is necessary for it to be described as “positive”. Therefore, we chose the rather vague expression “BMO which is highly suggestive of sacroiliitis”. For illustration, we have selected a few typical examples of BMO in sacroiliitis associated with SpA (figs 1 and 6) and in other conditions (fig 4 and supplementary fig 1). When only one BMO lesion for each MRI slice is visible, this should be clearly visible on consecutive slices as well, in order to reduce the possibility of error (fig 1). In doubtful cases a lesion (BMO) should not be considered as positive, a view that is supported by a recent report highlighting the prognostic role of more extensive BMO for the later development of radiographic sacroiliitis.6 For the detection of BMO the STIR technique is usually sufficient, as has already been systematically analysed for the SI joints13 19 and for the spine as part of clinical studies.14 31 The T1 sequence after application of gadolinium might give additional information in unclear cases and/or for the exclusion of possible artefacts, although it is generally not needed.
Structural damage lesions. (A and B) Sclerosis appears as hypointense signal in all sequences. (A) T1 sequence showing sclerotic areas (hypointense signal, white arrows) in the right iliac bone. (B) STIR sequence showing both sclerosis (hypointense signal, black arrow) but also extensive bone marrow oedema of the right sacroiliac (SI) joint, reflecting active sacroiliitis (same patient as in A). (C) Periarticular fat deposition. Fat accumulation appears as hyperintense signal (black arrows) on T1 sequences. Fat deposition may reflect previous inflammation of the SI joints. (D) Bony bridges/ankylosis. Bony bridges appear as low signal on T1 images. The signal is similar to the sacral interforaminal bone marrow signal which forms the reference of normal bone signal. In this example, bone buds directly facing each other have fused to form bony bridges (white arrows) across the joint.
Other inflammatory lesions such as synovitis, enthesitis, or capsulitis are certainly compatible with SpA-related sacroiliitis but occur very rarely as a single MRI finding without the simultaneous presence of typical BMO and, therefore, were not regarded as sufficiently specific to justify a diagnosis of sacroiliitis.
Lesions reflecting structural damage such as sclerosis, erosions and ankylosis of the SI joint are still graded primarily by x-ray examination but are also visible on MRI.15 32 One of the chronic lesions, periarticular fat deposition (fig 6), can only be seen by MRI and not by x-ray examination or CT and might be the first chronic lesion following active inflammation.33 At present, however, the value of the detection of minor structural lesions by MRI is unclear. Therefore, the group decided that the presence of structural damage lesions alone is not sufficient for defining sacroiliitis on MRI as applied in the ASAS classification criteria for axial SpA. Further studies are necessary to establish the place of structural MRI lesions of the SI joint in the classification and diagnosis of axial SpA.
In the attempt to better classify patients with axial SpA, ASAS first developed candidate criteria for axial SpA,34 and, thereafter validated these new criteria in a large prospective international study.12 Further, a new definition of inflammatory back pain has arisen from this international collaboration.35 For the first time in rheumatology, MRI has become a formal item in classification criteria.12 36 However, published studies on sacroiliitis on MRI usually rely on the experience of single doctors and an independent “gold standard” for sacroiliitis is lacking. Therefore, a definition of sacroiliitis on MRI (“positive MRI”) for application in the new ASAS criteria was needed. The definition presented here is primarily the result of a consensus process among an international group of rheumatologists and radiologists with experience in both SpA and MRI and not the result of a systematic data analysis. The results of this work were presented in detail to the ASAS members in January 2008 at the annual ASAS assembly, were discussed and refined and approved by a final vote. By using this approach we sought to integrate the available worldwide expertise on this topic. Nevertheless, these definitions should be revised if necessary. This might be by the inclusion of enthesitis or capsulitis or structural damage lesions if familiarity with MRI increases, or a precise definition of the minimum size of BMO if data from large systematic studies with healthy controls and patients with back pain become available. Currently, the proposed criteria for a “positive MRI” provide a first standardisation and a solid basis for the application of MRI in the new ASAS criteria for axial SpA.
REFERENCES
Supplementary materials
Web only appendix for 68;10:1520
Files in this Data Supplement:
Footnotes
Funding ASAS (Assessment of SpondyloArthritis international Society).
Competing interests None.
Provenance and Peer review Not commissioned; externally peer reviewed.
▸ Additional figures are published online only at http://ard.bmj.com/content/vol68/issue10