Article Text

Statistics from Altmetric.com
Multiple sclerosis (MS) is an inflammatory demyelinating disease of central nervous system (CNS) white matter.1 The aetiology is unknown but the condition is probably the result of a misdirected immune response against myelin antigens. Pathologically there are multiple plaques or areas of white matter inflammation, demyelination, and glial scarring or sclerosis. In addition to myelin damage, axon loss may occur as there is a close relation between myelin and axon.2 The inflammatory lesions are disseminated in time and space, and clinically the illness is characterised by relapsing episodes of neurological dysfunction.
In a commonly proposed sequence of events, autoreactive myelin specific CD4+ Th1 are activated in the periphery, probably by non-self antigens with a resemblance to myelin proteins.3 T cells interact with adhesion molecules, such as selectins and integrins, on the capillary endothelium and then migrate into the brain parenchyma in response to chemotactic signals. Matrix metalloproteases (MMPs) are important in facilitating T cell penetration through the endothelial basement membrane. Microglia and astrocytes reactivate T cells locally in the CNS by presentation of myelin proteins bound to class II MHC molecules. T cells stimulate macrophage activity by release of proinflammatory cytokines such as IL2, IFNγ, tumour necrosis factor α (TNFα) and lymphotoxin (LT). Activated macrophages phagocytose myelin, and damage myelin by release of proteases, nitric oxide metabolites, reactive oxygen species, eicosanoids, complement components and TNFα. Autoantibodies directed against myelin basic protein (MBP) and myelin oligodendrocyte glycoprotein (MOG) are involved in myelin damage.4 ,5
Experimental allergic (or autoimmune) encephalomyelitis (EAE) can be induced in a variety of animal species, including non-human primates, by immunisation with spinal cord homogenates, myelin proteins or their peptide derivatives. A number of different myelin proteins can induce EAE, including proteolipid protein (PLP), MBP, MOG, myelin associated glycoprotein (MAG), and 2'3' cyclic nucleotide 3'-phosphdiesterase (CNP). Immunisation induces brain inflammation accompanied by varied signs of neurological disease. EAE can be adaptively transferred by myelin sensitised T cells. EAE and MS share common clinical, histological, immunological and genetic features, and EAE is widely considered to be a relevant model for the human disease. TNFα and LT are key elements in the pathogenesis of MS and EAE (reviewed by Steinman6).
TNFα and LT in EAE
Many studies indicate that TNFα activity is increased during active disease. TNFα and LT mRNA can both be detected in the CNS in acute EAE, and are made predominantly by microglia and infiltrating macrophages.7 LT increases before the onset of clinical signs of EAE, while TNFα peaks at the height of clinical disease and during relapses.7-9 TNFα given systemically worsens the severity and duration of EAE and can trigger relapses.10 ,11 TNFα and LT are both directly toxic in culture to oligodendrocytes, cells that form the myelin sheath in the CNS.12 ,13 TNFα given directly into the vitreous chamber in mice causes demyelination of the optic nerve.14
TNFα production by astrocytes can be induced in culture. There is higher production of TNFα in astrocytes from rodent strains which are susceptible to EAE.15 The ability of MBP reactive T cell clones to transfer EAE correlates with their level of production of TNFα and LT.16 Altered peptide ligands reduce the production of TNFα and Th1 cytokines, and can reverse EAE.17 ,18
Bacterial superantigens can induce relapsing attacks of paralysis in EAE, an effect blocked by antibody against TNFα.19TNFα delivered locally by a T cell clone carrying a TNFα encoding retrovirus construct exacerbates EAE.20
Reduction of TNFα activity by a number of different means abrogates disease. Treatment of mice with anti-TNFα antibody21 ,22or neutralisation of TNFα and LT activity with soluble p55 TNF receptor23-25 blocks development of EAE. Rolipram, a selective phosphodiesterase type IV inhibitor that reduces production of TNFα and LT, reduces clinical signs of EAE.26-28
In summary, these studies lead to the conclusion that increased levels of TNFα activity exacerbate disease, while blockade of TNFα lessens disease in EAE models.
TNFα and LT transgenic and knockout mice
Transgenic experiments indicate that overexpression of TNFα can induce spontaneous disease. Overexpression of TNFα in the CNS of transgenic mice causes spontaneous inflammatory demyelination.29-31 Oligodendrocyte apoptosis and myelin vacuolation is observed in these animals.32 The effects of TNFα are prevented if the p55 TNF receptor is knocked out.32 Overexpression of TNFα in the CNS, even in mice lacking CD4, β-2 microglobulin, immunoglobulin μ chain, and RAG-1, is sufficient to induce demyelination.33
Gene knockout studies have examined the role of TNFα and LT in susceptibility to induced EAE. A complicating factor in several studies34 ,35 is that disruption of these genes causes developmental defects, such as abnormal lymph nodes, altered splenic architecture, and abnormal immune function. In a more recent study of TNFα and LT knockout mice, immunodeficiency was corrected in LTα-/- mice by reconstitution with bone marrow cells.36 Mice with TNFα knocked out, but with LTα present, had a delayed onset and shorter duration of disease. The absence of TNFα had the effect of impairing lymphocyte migration into the CNS. When LTα was knocked out, but TNFα was present, EAE developed normally. Similar results were seen in an earlier study of TNFα knockout mice.37The conclusion from these knockouts is that TNFα plays an important part in lymphocyte trafficking into the CNS.
Although TNFα is generally proinflammatory in EAE experiments, TNFα may be anti-inflammatory under some conditions. TNFα reduced EAE when given systemically using a recombinant vaccinia virus.38The effects of TNF and other cytokines vary depending on whether they are given systemically versus locally, timing of administration, and other factors. In another study of TNFα-/- knockout mice, MOG induced EAE was more severe in TNFα-/- mice than in littermate controls.39 TNFα given systemically was protective and prevented development of EAE. Presumably the explanation is one of cytokine redundancy, with other molecules substituting functionally for TNFα in this situation. Similarly, Th1 cells are generally implicated in EAE, and Th1 clones reactive to MBP can transfer disease.40 However in the study of Lafailleet al,41 anti-MBP Th2 cells were derived from MBP specific TCR transgenic mice, and transferred into RAG-1 knockout mice. The transferred anti-MBP specific Th2 cells were able to cause EAE. IL4 was present in the lesions, but no TNFα or other Th1 cytokines were present.
Despite these exceptions, the same generalisations hold true from experiments with TNFα transgenic and knockout mice. TNF expression in transgenic mice is sufficient to cause spontaneous inflammatory demyelination, while inactivation of the TNFα gene impairs lymphocyte migration into the CNS.
TNFα and LT in MS
As in EAE, TNFα and LT protein and mRNA can be demonstrated in MS plaques.42 ,43 TNFα positive cells include lymphocytes, macrophages, endothelial cells, astrocytes, and microglia.44 ,45
TNFα is present in the CSF of subjects with MS,46-48and the level of TNFα correlates with severity and progression of disease.49 TNFα increases the permeability of CNS endothelial cells.50 TNFα levels in CSF are higher in MS subjects with active disease and correlate with blood-brain barrier damage.51 CSF mononuclear cells from MS subjects show increased TNFα mRNA levels, compared with blood mononuclear cells, or compared with cells from the CSF of control subjects.52 ,53 PBLs maintained in culture from MS subjects produce more TNFα and LT than controls.54Disease exacerbation is correlated with higher levels of TNFα and LT mRNA in PBLs.55-58 TNFα production after mitogen stimulation of PBLs from MS subjects is increased before exacerbations.59
As well as being toxic to oligodendrocytes, TNFα, and to a lesser extent LT, is mitogenic for astrocytes in culture, and may contribute to reactive gliosis found in MS.60 ,61
Like EAE, these data suggest that higher levels of TNFα correlate with increased disease activity in MS.
TNF genes and susceptibility to MS
The genes encoding TNFα and LT are embedded within the major histocompatibility complex (MHC) in the human chromosomal segment 6p21, about 250 kb centromeric to the HLA-B gene and 355 kb telomeric to C2. Multiple polymorphisms have been identified in or near the TNF genes. However case-control population based studies have failed to detect significant genetic association with MS susceptibility or progression. Results indicating distortions of the expected allelic frequencies could be attributed to the effect of linkage disequilibrium with HLA-DR2.62
Current treatments for MS: effects on TNFα
Several currently used treatments for MS have effects on TNFα activity. Methylprednisolone intravenously, or oral prednisone, is commonly used in the treatment of MS exacerbations. The effects of corticosteroids include a decrease in TNFα activity by inhibiting transcription.63 There is a reduction of MMP-9 activity (gelatinase B), and increased levels of TIMP-3.64
Two forms of IFNß are currently used for the treatment of MS, IFNß1b (Betaseron) and IFNß1a (Avonex, Rebif). IFNß has several mechanisms of action (reviewed by Yong et al 65). Pre-treatment of T cells with IFNß decreases VLA-4 integrin expression and reduces subsequent TNFα production by microglia.66 IFNß may favour the production of anti-inflammatory cytokines,67-71 and decrease TNFα production.72 ,73 IFNß decreases TNFα receptor levels on T cells.74 IFNß decreases MMP-2 and MMP-9 activity and reduces T cell migration into the CNS.75 ,76
Copolymer-1 (Copaxone), a random copolymer of alanine, glutamic acid, tyrosine, and lysine, is the most recent immunomodulatory drug approved for the treatment of MS. Recent studies suggest that copolymer-1 acts as an altered peptide ligand, causing a shift from a Th1 to a Th2/Th3 response, with a decrease in TNFα mRNA levels.77
Therapeutic blockade of TNFα activity in MS
A study of two rapidly progressive MS subjects treated with the anti-TNFα antibody cA2 (Remicade, Centocor) was reported by Van Ostenet al in 1996.78 The subjects were given two infusions of 10 mg/kg of antibody at intervals of two weeks. There was no reported clinical worsening of disease. However, an increase in the number of gadolinium enhancing lesions on magnetic resonance imaging, a rise in CSF IgG index, and an increase in the number of lymphocytes in the CSF was observed after each infusion. The magnetic resonance imaging and CSF findings were felt to indicate intrathecal immune activation. VCAM-1 was detectable in CSF post-infusion, while levels of VCAM-1 and ICAM-1 were lower in serum. TNFα production by stimulated WBCs was lower after treatment. cA2 antibody could not be detected in CSF, and was probably not able to cross the blood-brain barrier. Unfortunately, there were no monthly pre-treatment scans to estimate ongoing disease activity in this small study.
A soluble dimeric p55 TNF receptor-immunoglobulin fusion protein (sTNFR-IgG p55; lenercept, Roche) was tested in a double blind placebo controlled study of 168 mainly relapsing-remitting MS subjects.78a Subjects were treated with 10, 50, or 100 mg of lenercept intravenously every four weeks, for a period of up to 48 weeks. Clinical evaluations and MRI were obtained every four weeks. The exacerbation rate was increased by 2%, 68%, and 50%, over the placebo rate, in subjects treated with 10, 50 and 100 mg of lenercept respectively (p = 0.007). There was a dose dependent decrease in the time to first exacerbation in treated groups (p = 0.006). There was a tendency for the duration and severity of exacerbations to be increased with lenercept, although this was not statistically significant. Side effects included headache, hot flushes, nausea, dyspnoea, and abdominal pain. Antibodies to lenercept were detected in most of the treated subjects. Trough serum concentrations of lenercept were detected in only a third of patients, and not in those subjects with high anti-lenercept antibody concentrations. New occurrences of rheumatoid factor or ANA were more common in the lenercept treated group. Despite clinical worsening, there were no significant changes in MRI measurements between groups. One explanation may be the timing of scans in relation to drug dosing. MRI scans were obtained four weeks after the preceding dose, and changes may therefore have been missed. However, it is also recognised that MRI changes have poor pathological specificity in MS, and poor correlation with clinical measures of disability. Newly active MRI lesions reflect changes in blood-brain barrier permeability, which may perhaps be separate from CNS inflammation.
Pentoxyfilline, a phosphodiesterase inhibitor, reduces TNFα production and prevents EAE79 ,80 and has been studied in MS. TNFα production is reduced in vitro,81 but there is no apparent effect on disease.82 ,83 Perfenidone, an experimental drug that prevents gliosis and blocks TNFα synthesis, is currently being tested in MS.
To date the results of TNFα blockade in MS have been disappointing, and seem to make disease worse, or at best have no effect. These results are unexpected and in contrast with animal models, where TNFα blockade is effective in ameliorating disease. The reasons for this difference are not clear at the present time.
Metalloproteinase inhibitors
The MMPs are a group of zinc containing proteolytic enzymes involved in the degradation and remodelling of the extracellular matrix.84 The family consists of approximately 18 members subdivided into collagenases, gelatinases, stromelysin, and membrane-type MMPs. T cells express predominantly MMP-2 (gelatinase A) and-9 (gelatinase B), while macrophages secrete a broader range and larger amounts of MMPs,85 including MMP-1, -2, -3, -7 (matrilysin), -9 and -12. Neurons, astrocytes, and oligodendrocytes also express MMPs.86-89 The activity of MMPs is tightly regulated at the level of transcription, by proenzyme activation, and by the activity of tissue inhibitors of metalloproteinases (TIMPs). Gene transcription can be induced by growth factors, inflammatory cytokines, and via cell-ECM or cell-cell interactions. MMPs are initially produced as inactive pro-MMPs, containing a zinc atom bound to a cysteine residue in the catalytic domain. Activating factors disrupt the zinc-cysteine interaction and expose the catalytic site. After activation, MMPs are regulated by the formation of complexes with one of the four TIMPs. MMP activity is tightly controlled by these means, but excess MMP production and activation may be an important factor in autoimmune diseases, including MS.
MMPs are needed to facilitate T cell penetration through the basement lamina of the vascular endothelium into the CNS. Increased MMP expression can be demonstrated in the CNS of subjects with MS90-95 and in animals with EAE.96 ,97 MMP inhibitors block degradation of the extracellular matrix and reduce entry of T cells into the CNS. One mechanism of action of IFNß in MS is the inhibition of MMP-9 activity of T lymphocytes.75 ,76
TNFα is initially produced as a 26 kDa membrane anchored protein and is converted to the mature, secreted 17 kDa protein by TNFα converting enzyme (TACE). MMP inhibitors prevent the conversion of TNFα into an active form. In addition, MMPs contribute directly to the degradation of myelin proteins, and MMP inhibitors may block this activity.
MMP inhibitors can block induction of EAE.98-102 A small trial in MS subjects of a combination of D-penicllamine and metacycline, which inhibit MMP-9 and t-PA, was reported. Ten patients with secondary progressive MS were treated over a period of one year. There was no improvement in Extended Disability Status Scale (EDSS) scores at one year, and there were problems with toxicity.103 Several MMP inhibitors are currently being tested in clinical trials in MS, but there are no published data at the present time.
Genomics and microarray technology
Current estimates suggest that there are approximately 100 000 genes in the human genome, and about one half of these have been partially or completely sequenced. Determination of which of the 100 000 genes are expressed is a useful initial step in understanding a disease process.
Microarray technology allows a large scale readout of gene expression. Several different types of microarrays are available, based on cDNAs, PCR products, or oligonucleotides immobilised on a solid support. The Affymetrix Genechip is a high density oligonucleotide array synthesised directly onto glass slides by a combination of photolithography and light activated chemistry.104 ,105The expression arrays contain as many as 400 000 24 × 24 μm synthesis features. Each synthesis feature or probe cell contains approximately 107 copies of a specific 25-mer DNA oligonucleotide sequence. The synthesis features are organised in pairs, consisting of a perfect match (PM) oligonucleotide and a mismatch oligonucleotide (MM) immediately below (fig 1). The MM oligonucleotide is identical except for a single base change at the middle position, and is used as a control for hybridisation specificity. Each gene on the array is represented by a series of 20 probe pairs, which span the sequence.

Chip design. A perfect match (PM) and an adjacent mismatch (MM) 25-mer DNA oligonucleotide probe pair is illustrated. The MM oligonucleotide has a single change at position 13.
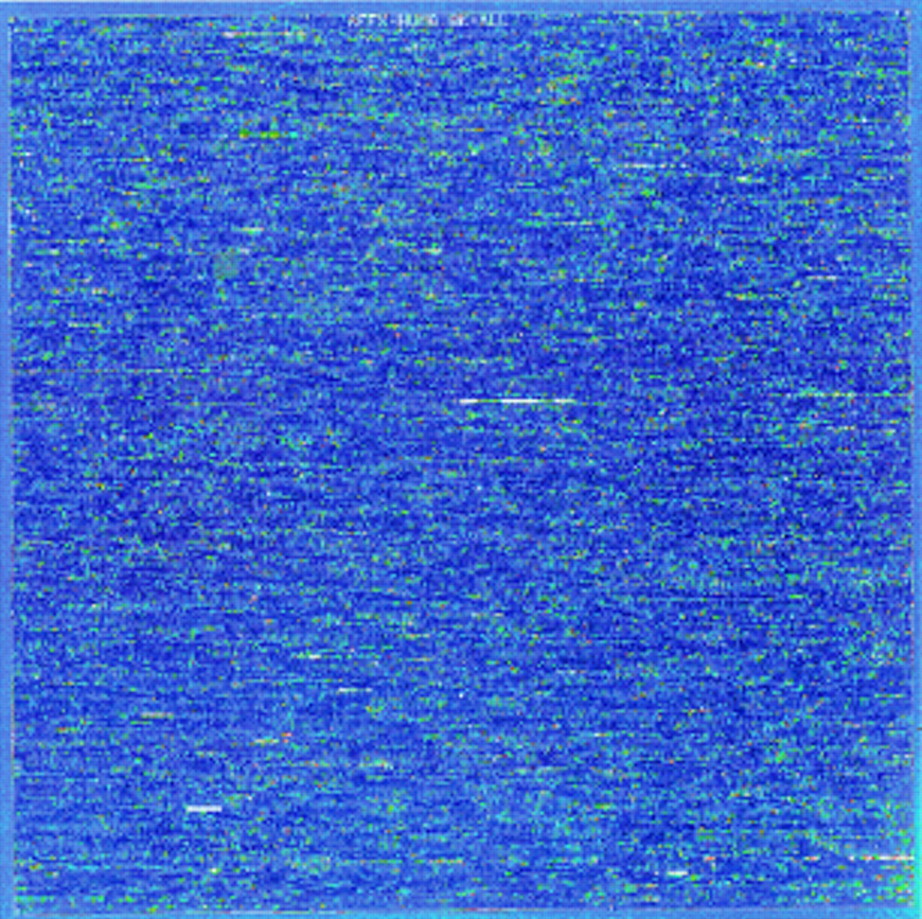
Samples are prepared for hybridisation to the array, first by isolation of polyA+ mRNA. Double stranded cDNA is then made, and the cDNA is used as a template to produce biotinylated cRNA (fig 2). The labelling procedure amplifies the mRNA population by about 150-fold. The cRNA is fragmented and hybridised to the array, forming hybrids between the biotinylated cRNA and the DNA oligonucleotides on the chip. The array is washed, stained with streptavidin-phycoerythrin, and scanned with a confocal laser microscope. A scanned image of a genechip is shown in figure 3, and a close up view in figure 4.
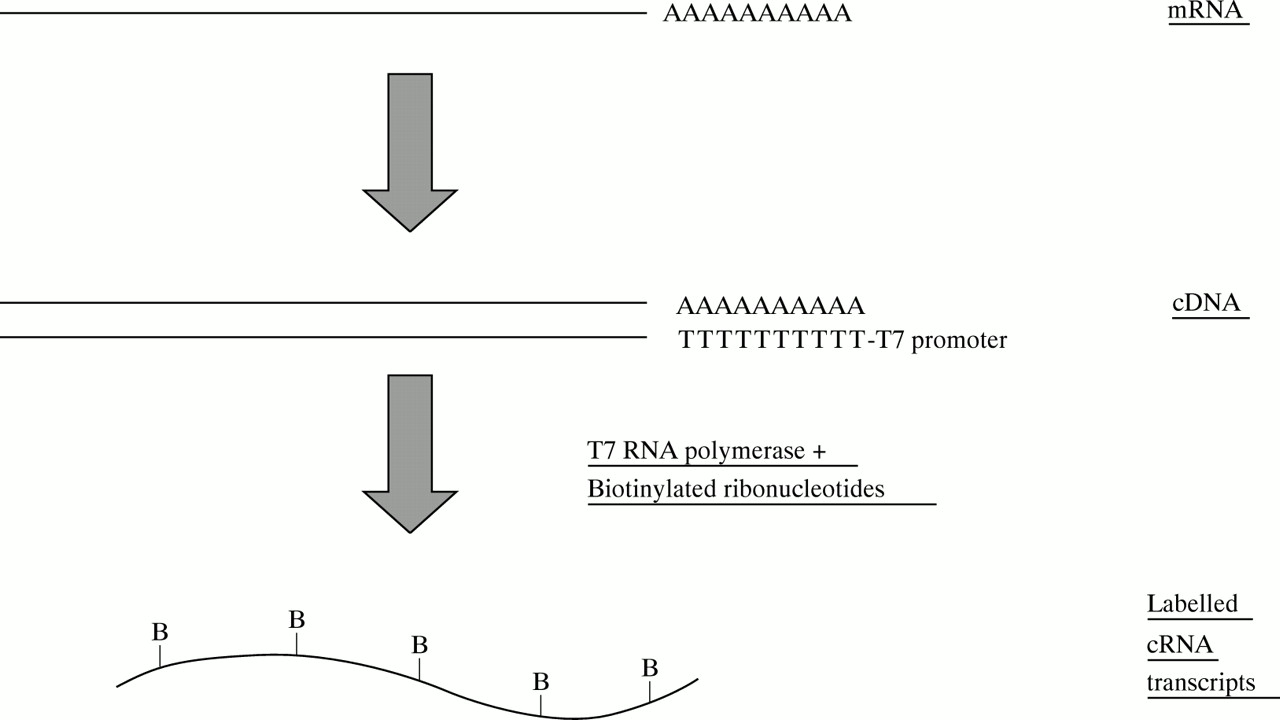
Sample preparation. A primer containing oligo-dT (T24) and a T7 RNA polymerase binding site is used for first strand cDNA synthesis. Double stranded cDNA is used for an in vitro transcription reaction, to make cRNA labelled with biotin-UTP and biotin-CTP.

Genechip image. The figure shows a scanned image of a HuGeneFL chip.

Close view of genechip. Individual synthesis features or probe cells can be seen. Each 24 × 24 μm probe cell is imaged by the scanner as a series of 3 μm pixels. The software aligns a grid to the image after scanning. A row of brighter PM probes can be seen, above a row of corresponding MM probes.
The average fluorescence intensity is calculated for each probe cell. The presence or absence of a particular RNA is determined from the hybridisation pattern, using PM and MM differences and ratios (fig5). The signal is proportional to the amount of bound, labelled cRNA. The relative concentrations of different RNAs in a population can be estimated from the signal intensity. A single sample is applied to each array, and the software compares arrays.

Hybridisation. Biotinylated cRNA, stained with streptavidin-phycoerythrin, binds preferentially to the PM oligonucleotide. Hybridisation is measured by calculation of PM-MM differences, and PM/MM ratios. The software makes a call of increased, decreased, or no change for each RNA, when comparing two chips.
Using this system, we have analysed several rodent EAE models, and human MS samples (unpublished data), to look for differentially expressed genes. The aim is to identify novel targets for drug development. A number of TNF related genes are represented on the arrays (table 1). Many genes known to be involved in demyelination are differentially expressed, along with a number of less well characterised genes. The data are complex, but provide a more global view of gene expression. A difficulty with this type of data is that it does not give functional information regarding the identified genes. Functional experiments such as gene inactivation, cellular localisation, and other types of studies are needed. Cluster analysis may provide functional clues by grouping together genes whose expression is co-regulated.106 The size of the data sets also presents a challenge.
TNF related genes represented on HuGeneFL array
Genomics has been likened to the biological equivalent of the chemical periodic table, but with 100 000 gene elements and an information space with more than two dimensions.107 The microarray approach will hopefully provide a more comprehensive view of TNF related pathways involved in demyelinating and other diseases.
Acknowledgments
The authors thank Renu Heller, Hans Gmuender, John Allard, Paul Klonowski, Eric Schadt, Stacy Wilson, Fengrong Zuo, and Matthew C Jeong. We thank Roche Bioscience for providing access to microarray technology. CL is supported by an Advanced Post-Doctoral Fellowship from the National Multiple Sclerosis Society. JRO. is a Fellow of the Esther and Joseph Klingenstein Foundation. LS is supported by NIH grants NS18235, NS30201, AI40953, and NS28579.
References
- 1.↵
- 2.↵
- 3.↵
- 4.↵
- 5.↵
- 6.↵
- 7.↵
- 8.↵
- 9.↵
- 10.↵
- 11.↵
- 12.↵
- 13.↵
- 14.↵
- 15.↵
- 16.↵
- 17.↵
- 18.↵
- 19.↵
- 20.↵
- 21.↵
- 22.↵
- 23.↵
- 24.↵
- 25.↵
- 26.↵
- 27.↵
- 28.↵
- 29.↵
- 30.↵
- 31.↵
- 32.↵
- 33.↵
- 34.↵
- 35.↵
- 36.↵
- 37.↵
- 38.↵
- 39.↵
- 40.↵
- 41.↵
- 42.↵
- 43.↵
- 44.↵
- 45.↵
- 46.↵
- 47.↵
- 48.↵
- 49.↵
- 50.↵
- 51.↵
- 52.↵
- 53.↵
- 54.↵
- 55.↵
- 56.↵
- 57.↵
- 58.↵
- 59.↵
- 60.↵
- 61.↵
- 62.↵
- 63.↵
- 64.↵
- 65.↵
- 66.↵
- 67.↵
- 68.↵
- 69.↵
- 70.↵
- 71.↵
- 72.↵
- 73.↵
- 74.↵
- 75.↵
- 76.↵
- 77.↵
- 78.↵
- 78a.
- 79.↵
- 80.↵
- 81.↵
- 82.↵
- 83.↵
- 84.↵
- 85.↵
- 86.↵
- 87.↵
- 88.↵
- 89.↵
- 90.↵
- 91.↵
- 92.↵
- 93.↵
- 94.↵
- 95.↵
- 96.↵
- 97.↵
- 98.↵
- 99.↵
- 100.↵
- 101.↵
- 102.↵
- 103.↵
- 104.↵
- 105.↵
- 106.↵
- 107.↵