Article Text

Abstract
Objective To evaluate the performance of the National Institute for Health and Clinical Excellence (NICE) mini-Global Registry of Acute Coronary Events (GRACE) (MG) and adjusted mini-GRACE (AMG) risk scores.
Design Retrospective observational study.
Setting 215 acute hospitals in England and Wales.
Patients 137 084 patients discharged from hospital with a diagnosis of acute myocardial infarction (AMI) between 2003 and 2009, as recorded in the Myocardial Ischaemia National Audit Project (MINAP).
Main outcome measures Model performance indices of calibration accuracy, discriminative and explanatory performance, including net reclassification index (NRI) and integrated discrimination improvement.
Results Of 495 263 index patients hospitalised with AMI, there were 53 196 ST elevation myocardial infarction and 83 888 non-ST elevation myocardial infarction (NSTEMI) (27.7%) cases with complete data for all AMG variables. For AMI, AMG calibration was better than MG calibration (Hosmer–Lemeshow goodness of fit test: p=0.33 vs p<0.05). MG and AMG predictive accuracy and discriminative ability were good (Brier score: 0.10 vs 0.09; C statistic: 0.82 and 0.84, respectively). The NRI of AMG over MG was 8.1% (p<0.05). Model performance was reduced in patients with NSTEMI, chronic heart failure, chronic renal failure and in patients aged ≥85 years.
Conclusions The AMG and MG risk scores, utilised by NICE, demonstrated good performance across a range of indices using MINAP data, but performed less well in higher risk subgroups. Although indices were better for AMG, its application may be constrained by missing predictors.
- Quality Of Care And Outcomes
Statistics from Altmetric.com
Introduction
The Global Registry of Acute Coronary Events (GRACE) risk score is recognised internationally as a tool for the risk stratification of non-ST elevation acute coronary syndromes,1–7 and its use in routine clinical practice is recommended by the European Society of Cardiology and the National Institute for Health and Clinical Excellence (NICE).8 ,9 Because it collects patient level data, an additional application of the GRACE risk score is case mix adjustment for comparative provider performance assessment.10 However, established acute coronary syndrome registries such as the Myocardial Ischaemia National Audit Project (MINAP) may not collect all eight GRACE predictor variables.11
In light of this, and as part of the development of a national clinical guideline for the management of unstable angina and non-ST elevation myocardial infarction (NSTEMI) in England, NICE utilised a modified version of the GRACE risk score using MINAP data (2005–2008). This model excluded creatinine and Killip class, and was named the mini-GRACE (MG) risk score.12 The MG risk score was further modified with ‘prescription of a loop diuretic during admission’ as a surrogate for Killip class and creatinine concentration re-coded as a categorical variable, and termed the adjusted mini-GRACE (AMG) risk score.12
The AMG and MG risk scores have not however been studied in detail in patients with ST elevation myocardial infarction (STEMI) and NSTEMI using data from the MINAP registry. Using a range of model performance indices, we aimed to evaluate AMG and MG, to ascertain whether they may be considered for patient level adjustment in studies of provider performance using MINAP data.
Methods
Study design
The analyses were based on data from MINAP whose national database was established in 1999 to examine the quality of management of acute myocardial infarction (AMI) in England and Wales and to meet the audit requirements of the National Service Framework for Coronary Heart Disease.11–15 This study includes data collected on behalf of the British Cardiovascular Society under the auspices of the National Institute for Cardiovascular Outcomes Research (NICOR) in which patient identity was protected.
Data for patients admitted with an acute coronary syndrome are collected prospectively at each acute hospital by a secure electronic system, developed by the Central Cardiac Audit Database, electronically encrypted and transferred online to a central database.11 ,16 The Central Cardiac Audit Database is part of the NICOR based at University College London. MINAP is overseen by a multi-professional steering group representing the stakeholders17 and the NICOR executive.18 Each patient entry offers details of the patient journey, including the method and timing of admission, inpatient investigations, treatment and date of all-cause death (from linkage to the Medical Research Information System, part of the National Health Service (NHS) Information Centre using a unique NHS number). Data entry is subject to routine online error checking. There is a mandatory annual data validation exercise for each hospital.19
Ethics
NICOR, which includes MINAP (Ref: NIGB: ECC 1-06 (d)/2011), has support under section 251 of the NHS Act 2006. On seeking advice from Leeds (West) Research Ethics Committee, formal ethical approval was not required under NHS research governance arrangements for the study.
Cohort description
The MINAP cohort comprised 495 263 index patients with a final diagnosis of AMI admitted to 236 acute hospitals in England and Wales between 1 January 2003 and 31 December 2009. Of those, 137 084 (27.7%) patient records held complete data to permit calculation of the AMG risk score, which formed the analytic cohort from 215 acute hospitals. Thus patients with complete AMG data had an MG and AMG score calculated and were compared.
The final diagnosis was formed from the patient's presenting history, clinical examination and the results of inpatient investigations (including troponin measurement), and made by a senior member of the medical staff prior to entry of data into MINAP. The consensus document of the Joint European Society of Cardiology/American College of Cardiology20 was used as the diagnostic standard for AMI and provided the basis for categorisation into STEMI and NSTEMI.
Statistical methods
The MG risk score for 6 month mortality from hospitalisation with AMI comprised six of the eight GRACE variables: age, admission systolic blood pressure, heart rate, electrocardiographic ST segment deviation, cardiac arrest and elevated cardiac enzymes (defined as a cardiac troponin concentration >0.05 ng/ml). In line with NICE guidance,9 ,12 an MG score was calculated for each patient using the scoring system and coefficients described by the GRACE investigators.3 For the AMG risk score, ‘use of loop diuretic’ (as a surrogate for Killip class II, and assigned a score of 20 points) and creatinine concentration (using the coefficients described by GRACE) were added to the MG risk score, and the total score calculated for each patient.
The AMG and MG variables were used to predict 6 month all-cause mortality risk using logistic regression with binomial distribution and a log link. The relationship between the scores and the predicted 6 month mortality risk was quantified using Pearson's correlation coefficient. They were also graphically compared with the published corresponding 24 categories of the GRACE predicted 6 month mortality.3
Model performance indices
The Hosmer–Lemeshow goodness of fit test (HLT) was used to assess calibration of the models—whether the observed mortality rates matched the expected mortality rates in subgroups of 100 patients. A high HLT χ2 value and p value <0.05 suggests a significant disagreement between observed and expected rates and therefore a poor model fit.21 A McFadden's pseudo R2 was used to quantify the proportion of the variation in the data explained by the linear expression for the mean part of the model. A pseudo R2<0.2 suggests a poor model fit, 0.2–0.4 a fair model fit and >0.4 a good model fit.22 The Brier score was used to measure the average squared deviation between the predicted probabilities of death and the observed mortality rates—the accuracy of the probability assessment. A Brier score of 1 suggests no accuracy, a score of 0 suggests perfect accuracy and a score of 0.25 suggests half the predicted events are correct and the other half not.23 The C statistic was used to evaluate the discriminative performance of the models. A C statistic close to 1 suggests near perfect discrimination and close to 0.5 almost no discrimination.23
The increased discriminative value of AMG over MG was examined with the net reclassification index (NRI) and the integrated discrimination improvement (IDI).23 The NRI was used to quantify the proportion of patients moving up or down 6 month mortality risk categories of <3% (low), 3.0% to <6% (intermediate) and ≥6% (high)12 between the two models. The IDI considers the change in the estimated prediction probabilities as a continuous rather than prespecified categorical variable.
Model performance was studied in the analytic cohort of AMI, including STEMI and NSTEMI, and within subgroups of patients with diabetes mellitus, chronic heart failure, chronic renal failure, patients aged ≥85 years and by sex. All analyses were performed using Stata V.11.2 (2009).
Results
Study characteristics
Of the analytic cohort with complete data for AMG, 53 196 (38.8%) were STEMI and 83 888 (61.2%) were NSTEMI, from 215 hospitals in England and Wales. The 6 month mortality rates (95% CI) from admission were STEMI 12.3% (12.0% to 12.6%) and NSTEMI 15.6% (15.3% to 15.8%). The baseline characteristics illustrate older age and greater comorbidity in NSTEMI than STEMI patients (table 1). Although there appeared to be limited systematic differences between missing and complete AMG variable data, higher 6 month mortality rates were observed for both STEMI and NSTEMI missing AMG variable cases compared with complete cases.
Baseline characteristics of the analytic cohort by STEMI and NSTEMI for the adjusted mini-GRACE risk score
Predicted mortality risk
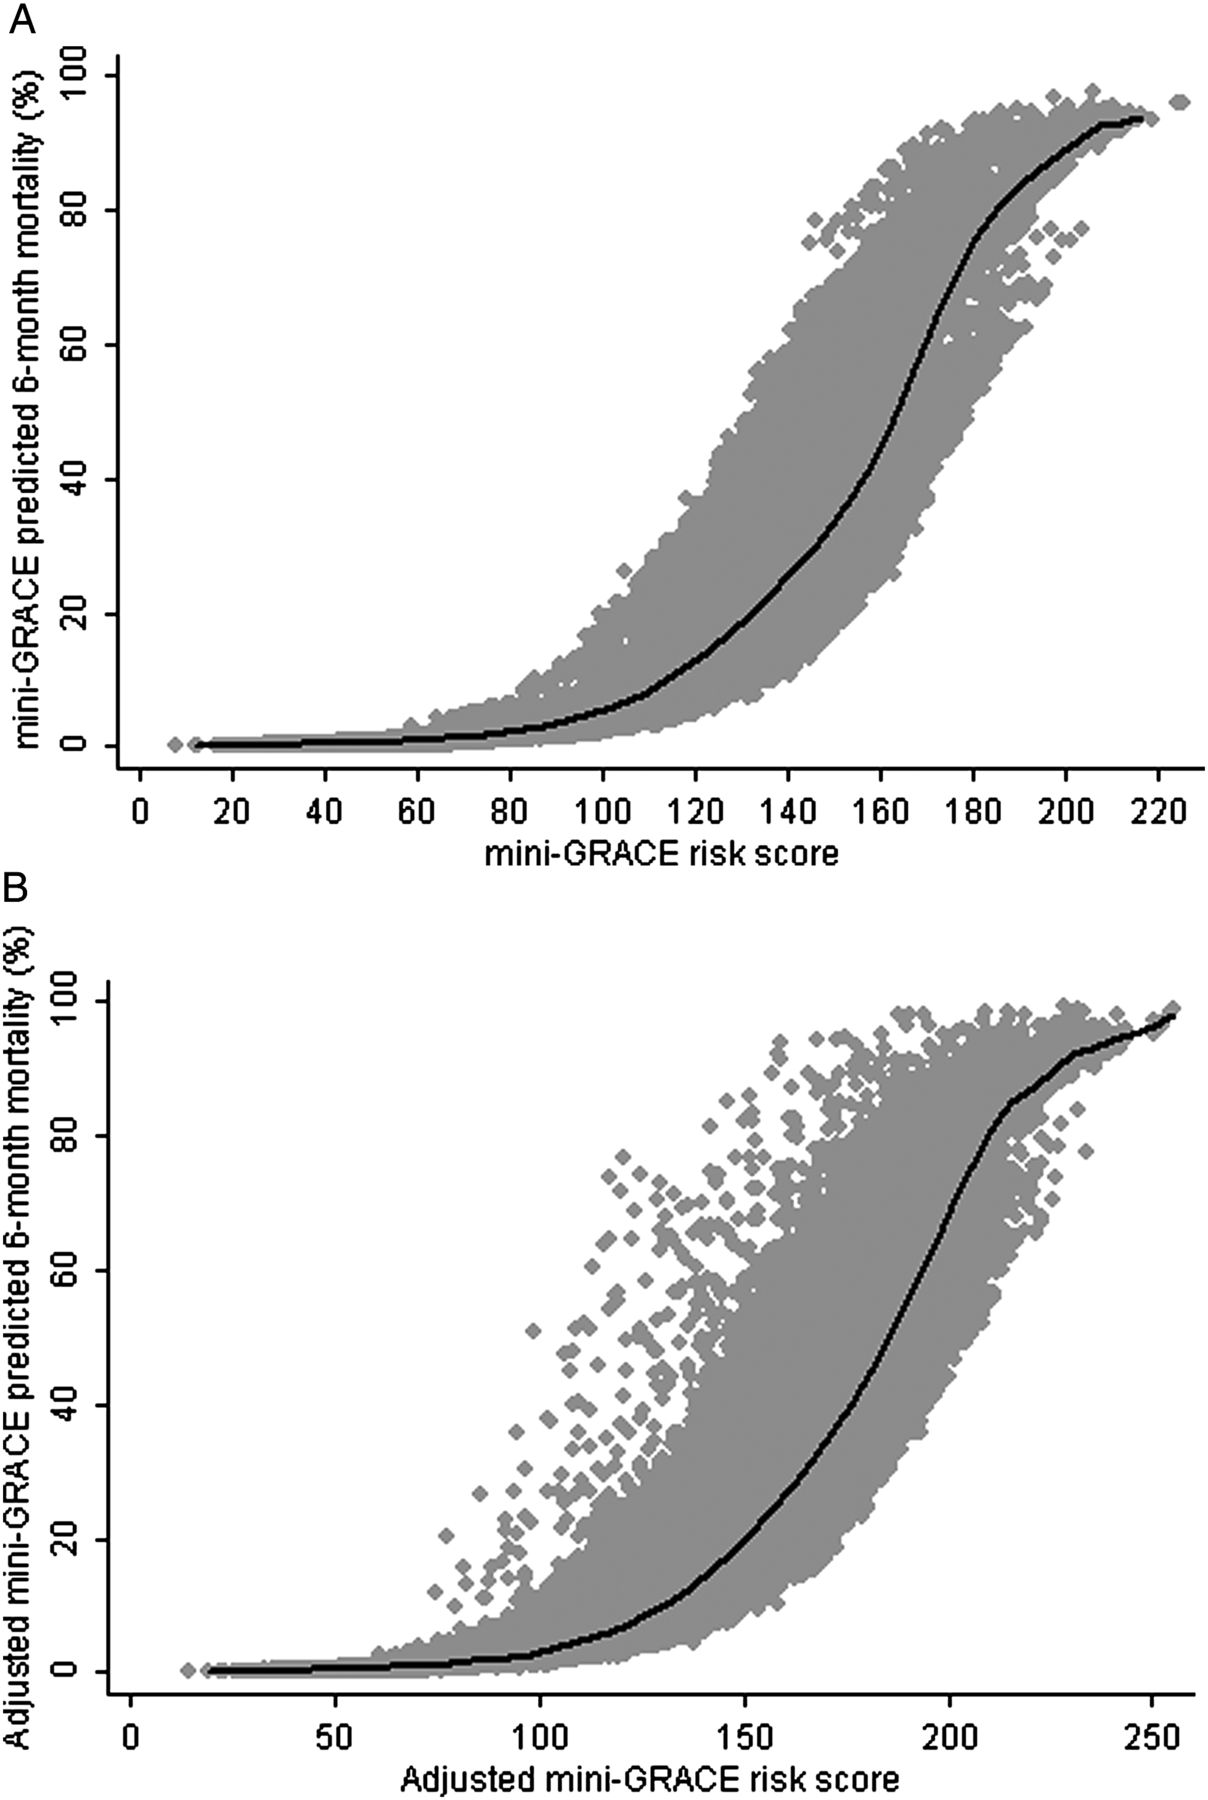
The mean (SD) MG and AMG 6 month risk scores were: AMI 111.8 (29.8) and 126.0 (35.2); STEMI 113.1 (29.8) and 125.2 (34.2); and NSTEMI 111.0 (29.8) and 126.5 (35.8), respectively. Each risk score showed good correlation with its respective 6 month mortality prediction in patients with AMI (MG: r=0.82, p<0.001; AMG: r=0.80, p<0.001) (figure 1).

Kernel weighted local polynomial smoothing plots of (A) mini-GRACE risk score and (B) adjusted mini-GRACE risk score against respective predicted 6 month mortality following acute myocardial infarction. GRACE, Global Registry of Acute Coronary Events.
The MG risk score overpredicted 6 month mortality, although at lower risk (<5% risk of 6 month mortality) it correlated well with the published GRACE predicted mortality risk3 (figure 2). Overall there was a strong correlation between the AMG risk score and GRACE 6 month mortality prediction. For patients with a GRACE predicted 6 month mortality risk ≤20% (which encompassed around 75% of the analytic cohort) however, the AMG score underpredicted 6 month mortality.

(A) Scatterplot of GRACE versus mini-GRACE (MG) predicted 6 month mortality risk. (B) Scatterplot of GRACE versus MG predicted 6 month mortality risk restricted to risk ≤20%. (C) Scatterplot of GRACE versus adjusted mini-GRACE (AMG) predicted 6 month mortality risk. (D) Scatterplot of GRACE versus AMG predicted 6 month mortality risk restricted to risk ≤20%. GRACE, Global Registry of Acute Coronary Events.
Model performance
While both risk scores demonstrated good accuracy, and discriminative and explanatory performance, the MG risk score showed significant disagreement between observed and expected 6 month mortality rates for AMI and STEMI, and AMG for STEMI and NSTEMI (table 2). However, MG and AMG accuracy, and discriminative and explanatory performance were better for STEMI.
Mini-GRACE and adjusted mini-GRACE model performance
Model reclassification
The increased discriminative value of AMG over MG was shown by IDI=2.6% (p<0.05) and NRI=8.1% (p<0.05). The AMG risk score reclassified 1247 (4.0%) and 212 (0.7%) low risk patients to intermediate and high risk, respectively. It reclassified 5954 (27.4%) and 2519 (11.6%) intermediate risk patients to low and high risk, respectively, and only 7425 (9.4%) high risk patients to intermediate risk. For STEMI the IDI was 2.4% (p<0.05) and the NRI was 6.5% (p<0.05), and for NSTEMI the IDI was 2.6% (p<0.05) and the NRI was 8.4% (p<0.05). A confusion matrix of MG and AMG risk category against observed 6 month mortality is shown in table 3.
Confusion matrix of observed 6 month mortality against mini-GRACE and adjusted mini-GRACE predicted 6 month risk group
Model performance in higher risk subgroups
For both AMG and MG, accuracy, and discriminative and explanatory performance was reduced in patients with chronic heart failure, chronic renal failure and in patients aged ≥85 years, and increased in women, STEMI and diabetes (table 4).
Mini-GRACE and adjusted mini-GRACE model calibration and discrimination by acute myocardial infarction type and subgroup
Discussion
The coalition Government has recalibrated the NHS, emphasising that the commissioning and delivery of healthcare should be based on the quality of care delivered rather than metrics of delivery, such as waiting times.24–26 Mortality rates after hospitalisation with AMI, in part, reflect hospital quality of care. Methods such as patient level adjustment allow more considered quantification of hospital level mortality rates.10 This study shows that the MG and AMG risk scores, utilised by NICE,9 ,12 have good model performance across a range of indices and may be used to calculate 6 month mortality risk after hospitalisation with AMI. Consequently, this may allow hospital level AMI care to be studied more appropriately.
The NICE guidance for unstable angina and NSTEMI recommends coronary intervention and antithrombotic treatments in higher risk patients hospitalised with NSTEMI.9 Yet a well document risk–treatment paradox exists.27–29 The AMG and MG risk scores allow case mix adjustment thereby enabling the comparison of quality of care in England and Wales according to patient risk. That is, the AMG and MG risk scores perform well in MINAP data and simplify the potential for wider clinical application, which may, in turn, improve care.
No other studies have evaluated the NICE MG and AMG risk scores in patient subgroups across the wider spectrum of AMI phenotypes. The GRACE risk score has been validated in many studies,1 ,2 ,4–6 ,30 ,31 including a study using MINAP data.4 While this study suggested good discriminative performance (C statistic, 95% CI) for 6 month mortality (0.80, 0.79 to 0.80), the model was limited in light of data collected by MINAP at that time. Our study adds to the literature, suggesting that the use of surrogate data for missing GRACE predictors does not result in poor model performance.
While overall MG and AMG performance was reduced in patients with chronic heart failure, chronic renal failure and in patients aged ≥85 years, overall performance appeared better than that of the GRACE model used in the earlier MINAP validation study (C statistic (95% CI)): 0.80 (0.79 to 0.80) versus MG 0.82 (0.81 to 0.82) and AMG 0.84 (0.83 to 0.84). The disparity may be explained by the differences between the two studies: firstly, the present study utilised the published GRACE risk score coefficients to mimic the score in the real world while Gale et al generated coefficients from the MINAP dataset. Secondly, we modelled additional GRACE variables: cardiac arrest and creatinine, which also may have improved model performance.
On balance, the AMG risk score appeared to be superior to the MG risk score (reclassifying over 8% of patients of the 6 month MG risk prediction and showing better correlation with published GRACE 6 month risk prediction). AMG however relied on the inclusion of two further variables, which reduced the numbers of available complete cases by 58.9% from 333 515 for complete MG cases to 137 084 for complete AMG cases. Even though modelling data missingness10 and multiple imputation32 are methods by which concerns over data quality may be countered, encouraging good data collection at source is preferential.33 Moreover, mandatory collection of AMG variables in MINAP would allow more appropriate adjustment of case mix so that hospital performance may be represented fairly and relinquish the drive to utilise administrative data such as hospital episode statistics.
Limitations
Only 27.7% of cases of AMI had complete data to allow the calculation of the AMG score. A reduced number of cases due to data missingness (or analysis of subgroup populations such as those with diabetes) may have biased model performance and the results may not, therefore, be representative of the wider AMI population. However, systematic differences between those with and without missing data for STEMI and NSTEMI were not substantial (table 1). The HLT was used as an estimate for model calibration when it is influenced by the numbers of cases (and therefore the number of groups) in the study. It is possible that alternative measures of model performance may report different outcomes.
Conclusion
NICE advocates the use of the GRACE risk score to predict 6 month mortality for NSTEMI.9 ,12 This study demonstrates that two surrogate (MG and AGM) risk scores of the GRACE model, derived from MINAP data, are applicable to patients hospitalised with AMI in England and Wales. Furthermore, the MG and AMG perform well at generating scores and predicting 6 month mortality and, therefore, are appropriate for use in MINAP for the retrospective adjustment of case mix to allow the comparison of hospital provider performance. While performance indices were better for AMG, the degree of missing data may limit its application.
Key messages
-
The NICE mini-GRACE (MG) and adjusted mini-GRACE (AMG) risk scores perform well in MINAP data.
-
The AMG risk score performs better than the MG risk score, but its application may be constrained by missing predictors.
-
The AMG and MG risk score allow adjustment for case mix such that hospital care (including the use of evidence based therapies according to risk) may be studied in more detail.
Acknowledgments
The extract from the MINAP database was provided by the MINAP Academic Group, National Institute for Cardiovascular Outcomes, University College London. We acknowledge all of the hospitals in England and Wales for their contribution of data to MINAP.
References
Footnotes
-
Contributors ADS and CPG: concept, design, analysis, interpretation of the data, and drafting and revision of the manuscript. SR: design and analysis of the data. PDB, BAC, RMW and KP: statistical support, analysis, interpretation of the data and revision of the manuscript. PDB, JIW, JED, KAAF and ASH: analysis, interpretation of the data, and drafting and revision of the manuscript.
-
Funding British Heart Foundation grant (PG/07/057/23215) and the National Institute for Health Research grant (NIHR/CS/009/004).
-
Competing interests None.
-
Provenance and peer review Not commissioned; externally peer reviewed.