Article Text

Abstract
Objective To perform a mechanistic study on the effect of interleukin (IL)-1 blockade by anakinra in patients with refractory myositis and to explore possible predictive biomarkers.
Methods Fifteen patients with refractory myositis were treated with anakinra for 12 months. Clinical response was assessed by the six-item core set measures of disease activity International Myositis Assessment and Clinical Studies (IMACS) and functional index (FI). Repeated muscle biopsies were investigated for cellular infiltrates, IL-1α, IL-1β, IL-1Ra and major histocompatibility complex-class I by immunohistochemistry. Serum levels of IL-1Ra and granulocyte colony-stimulating factor (G-CSF) were measured by ELISA. T cell phenotype and functional assays were investigated by multicolour flow cytometry.
Results Seven patients had clinical response according to IMACS, four of them also showed improved FI. Responders had higher baseline extramuscular score compared with non-responders. In muscle biopsies, baseline CD163 macrophages and IL-1α expression were inversely correlated with muscle performance after 6 months treatment; all responders had IL-1Ra expression in the post-treatment biopsies but only 3/8 non-responders. In serum, IL-1Ra levels were increased and G-CSF was decreased after 6 months treatment, but their levels and changes were not related to clinical response. For T cells, an inverse correlation between baseline frequency of CD4 activated/memory T cells and decreased creatine kinase levels was observed. Five of six patients demonstrated less IL-17A and more IFN-γ secreting CD4 T cells after 6 months treatment. Moreover, anakinra reduced IL-17A secretion in vitro.
Conclusions Patients with myositis may respond to anakinra. Extramuscular score, muscle CD163 macrophages and IL-1α expression, blood CD4 activated/memory T cells might associate with anakinra treatment response. Blocking the IL-1 receptor disfavoured Th17 cell differentiation both in vivo and in vitro.
Statistics from Altmetric.com
Introduction
Polymyositis (PM), dermatomyositis (DM) and inclusion body myositis (IBM), collectively named myositis, primarily cause muscle weakness.1–4 Untreated, these disorders could lead to severe impairment and even life-threatening symptoms. Treatment with long-term, high-dose glucocorticoids has improved outcome of PM and DM, but side effects are common. To reduce the risks with glucocorticoids, combinations with other immunosuppressive agents, such as azathioprine (AZA) or methotrexate (MTX), are recommended,5–8 but still many patients have only a partial response or do not respond at all.9 ,10 IBM is generally resistant to treatment with glucocorticoids and immunosuppressive drugs. Thus, new therapies are warranted.
A way forward to develop new therapies is through improved understanding of molecular pathways. This has been helpful in the development of targeted therapies, such as tumour necrosis factor (TNF) blockade in rheumatoid arthritis.11 However, TNF blockade was much less successful and even caused flare in treatment of myositis.12–15
Interleukin (IL)-1α and IL-1β are consistently expressed in muscle tissue of the three myositis subtypes: PM, DM and IBM.16–25 IL-1 is mainly produced by activated macrophages and endothelial cells20 ,21 ,23 and may increase the expression of proinflammatory genes. It also increases expression of adhesion molecules, such as intracellular adhesion molecule (ICAM)-1 and vascular cell adhesion molecule (VCAM)-1 on endothelial cells; both of which are upregulated in muscle tissue in patients with myositis.26–29 IL-1 may also exert several effects on skeletal muscle. IL-1α can suppress myoblast proliferation and myoblast fusion, leading to poor muscle cell regeneration.30 IL-1 receptors are expressed on endothelial cells31 and were more recently also demonstrated to be expressed on sarcolemma, and colocalised with its reciprocal ligands in PM and DM patients, further supporting a role of IL-1 in the pathogenesis of myositis.19
The aim of this study was to test the potential role of IL-1 in patients with refractory myositis by evaluating effects of IL-1 blockade on clinical outcome measures and on molecular effects in muscle tissue and blood. We used anakinra, a recombinant IL-1 receptor antagonist (Ra), which can bind non-productively to IL-1RI and inhibit activities of both IL-1α and IL-1β.
Patients and methods
Patients, inclusion and exclusion criteria
Fifteen patients with refractory myositis (eight women and seven men; median age=58 years, range 45–77; median disease duration=7 years, range 10 months–19 years) were included in this study. All patients had previously been treated with high-dose prednisolone in combination with AZA or MTX. Six patients had definite PM and four had definite DM.1 ,2 ,32 Five patients had IBM.33 Detailed clinical information of each patient is presented in table 1.
Individual clinical data of the patients with refractory myositis in this study
Inclusion criteria: men and women 18–80 years of age with diagnosis of PM, DM or IBM, muscle performance reduced by at least 20% below predicted value measured by functional index (FI) of myositis and failure to respond to treatment with high-dose glucocorticoids (0.75 mg/kg/day) for at least 1 month in combination with AZA or MTX for at least 2 months. The FI is a disease-specific tool assessing the number of correct performed repetitions in 10 muscle groups with a total score of 64.34 All patients gave informed consent.
Exclusion criteria: serious infections, such as hepatitis, pneumonia, pyelonephritis in the previous 3 months; history of opportunistic infections, such as tuberculosis, drug-resistant atypical mycobacterium, active pneumocystis carinii, active cytomegalovirus infection; documented HIV infection; alcoholism, alcoholic liver disease or other chronic liver disease; chest x-ray suggestive of active tuberculosis; pregnancy, nursing mothers or patients with planned pregnancy within one and a half years from enrolment.
Interstitial lung disease (ILD) was not a major clinical manifestation in any of the patients in this study. Only two patients had minimal lung fibrosis according to high-resolution CT and chest x-ray at study start, and this was unchanged at the end of the study.
Study design
This study was a 12-month open-label mechanistic study. Anakinra was self-administered subcutaneously 100 mg/day. According to the study protocol, allowed concomitant treatment included AZA (n=7), MTX (n=6) or antimalarial drugs (n=1) in stable doses during the trial (table 1). Glucocorticoids (n=11) were allowed to be reduced following a standardised reduction schedule. Other immunosuppressive drugs, such as cyclosporine A, intravenous immunoglobulin (IvIg) and cyclophosphamide, should be stopped 2 months prior to trial start. Physical exercise according to a standard protocol at an unchanged level was allowed.
Outcome assessment and response criteria
Clinical assessments and laboratory tests were performed at study start (month 0) and at months 1–6, 9 and 12, and included six-item core set measures of disease activity as proposed by The International Myositis Assessment and Clinical Studies Group (IMACS): physician's and patient's global assessment on a visual analogue scale (VAS), manual muscle test in eight muscle groups (MMT-8) on the dominant side, muscular and extramuscular disease activity (Myositis Disease Activity Assessment Visual Analogue Scales (MYOACT)), the health assessment questionnaire (HAQ) and muscle-associated enzymes, creatine kinase (CK), lactate dehydrogenase, alanine aminotransferase and aspartate aminotransferase.35–38 A physical therapist unaware of the physician’s scoring of disease activity assessed muscle performance by FI at months 0, 3, 6, 9 and 12.
Response was defined according to the suggestion by IMACS as ≥20% improvement in three or more of the six core set parameters of disease activity and no more than two worsened ≥25% which could not include MMT-8.37 Worsening was defined by ≥30% reduction in any three of the six core set parameters. Improvement of FI was defined as ≥20% increase, whereas, worsening was defined as ≥20% reduction. The changes, at all time points, were defined as the percentages of changes compared with study start.
Muscle biopsies and immunohistochemistry
Muscle biopsies were performed before and after 6 months of anakinra treatment in 14 patients who consented to repeat biopsies. The muscle biopsies were frozen in isopenthane prechilled by liquid nitrogen and then stored at −70°C until processing.
Immunohistochemistry staining was performed to identify T lymphocytes (CD3), macrophages (CD68 and CD163), IL-1α, IL-1β, IL-1Ra, and major histocompatibility complex (MHC) class I in muscles tissues as described earlier.21 Isotype-matched irrelevant antibodies were included as negative controls. The first and last sections were stained with haematoxylin-eosin to confirm that the histopathological changes remained unchanged throughout the biopsy specimen.
Quantification of staining on whole tissue sections was performed on coded slides by computerised image analysis (Leica Qwin, Leica Microsystems Imaging Solutions, Cambridge, UK).39 Briefly, CD3, CD68, CD163, IL-1β and IL-1Ra expression is presented both as the number of positively stained mononuclear inflammatory cells per total tissue area (mm2) and as the percentage of positively stained area of total tissue area (mm2). IL-1α expression was calculated separately in different cellular structures; and is expressed as the number of IL-1α positive infiltrating mononuclear cells, capillaries, larger blood vessels per total tissue area, and as the total IL-1α positive area of the total tissue area. MHC class I was assessed as the percentage of positively stained muscle fibres of the total number of muscle fibres.
Chemiluminescent immunoassay and ELISA
In a previous anakinra study based on juvenile idiopathic arthritis, the group of patients with lower pretreatment serum levels of granulocyte colony-stimulating factor (G-CSF) exhibited good response to anakinra.40 To investigate whether our patients also showed this difference, a chemiluminescent immunoassay was performed to measure serum levels of G-CSF. Serum levels of IL-1Ra at baseline and after anakinra treatment were measured by ELISA. Commercial kits were used and procedures were performed according to the instructions.
T cell phenotype and functional assay
Peripheral blood samples were taken simultaneously with muscle biopsies before and after 6 months of treatment, a time point when effects of anakinra on circulating T cells could be expected.41 Peripheral blood mononuclear cells (PBMCs) were prepared by Ficoll separation and cryopreserved until use. As controls, PBMCs from six healthy donors were included in the assay.
For phenotype cellular assay, single-cell suspensions of PBMCs were treated with LIVE/DEAD Fixable Green Dead Cell Stain (Invitrogen) and stained for surface expression of CD3, CD14, CD4, CD8, CD45RO, HLA-DR or isotype-matched control antibodies.
For functional cellular assay, PBMCs were stimulated with plate-bound anti-CD3 (2.5 μg/ml clone OKT-3) and cultured in RPMI-1640 supplemented with 5% pooled human sera, penicillin (100 U/ml), streptomycin (100 μg/ml), 2 mM L-glutamine, 10 mM HEPES for 6 h, with 10 μg/ml brefeldin A (Sigma–Aldrich) added for the last 4 h. Following stimulation, cells were treated with LIVE/DEAD Fixable Green Dead Cell Stain and then stained for surface expression of CD3, CD4 and CD14. Cells were then washed, fixed and permeabilised using cytofix/cytoperm fixation/permeabilisation solution kit (BD bioscience) before being stained for intracellular expression of interferon (INF)γ and IL-17A. Background levels were determined by unstimulated cells.
Samples were run on a CyAn ADP Analyser (DAKO, Glostrup, Denmark) and the data were analysed by FlowJo software V.8.6.36 (Tree star, Ashland, Oregon, USA).
Cytometric bead array
To confirm the effects of anakinra on Th17 cells, we investigated IL-17A secretion of PBMCs from three patients with active myositis, in the presence and absence of anakinra in vitro. These patients were not treated by anakinra. As controls, we used adalimumab (TNF blockade). Detailed clinical information of these three patients is presented in online supplementary table S1.
PBMCs were stimulated with anti-CD3 as described above, and cultured with or without anakinra (2.5 μg/ml) or adalimumab (100 μg/ml) for 5 days. Supernatants were collected and commercial cytometric bead array (CBA) kits were used to detect the concentration of IL-17A and TNF before and after treatment. All procedures were performed according to the manufacture's instructions.
Detailed information of the antibodies used in immunohistochemistry, flowcytometry and kits used for immunoassay and CBA is presented in online supplementary table S2.
Statistical analyses
Statistical analyses were performed using Statistica V.10.0 from StatSoft (Tulsa, Oklahoma, USA). Mann–Whitney U test was used when comparing the parameters between responders and non-responders. Wilcoxon's signed rank test was used when comparing the parameters before and after treatment. Spearman's rank correlation was used to assess the correlation between clinical outcome and biomarkers. When analysing the data regarding before and after treatment, the data from the patients withdrawn before the analysed time point were omitted; p<0.05 was considered significant.
Results
Seven out of 15 patients showed clinical response to anakinra treatment
Seven out of 15 patients fulfilled the improvement criteria according to IMACS definition: five patients at month 3 (2 DM, 2 PM, 1 IBM), one at month 6 (PM), and one at month 12 (DM). Five patients had unchanged disease activity, and three patients worsened.
Safety data
Three patients worsened according to the definition proposed by IMACS; one with PM worsened at month 12 and one patient with DM worsened at month 3. The latter patient discontinued treatment the same month due to an intense headache after administration of the injection and increased muscle symptoms. After intensified treatment with MTX and prednisolone, the patient improved. A third patient, with IBM, worsened at month 3 and withdrew from the study at month 6 due to lack of efficacy of anakinra. MMT-8 did not worsen by=>25% in any patient.
Six patients withdrew from the study prematurely. Two were among the patients who fulfilled criteria for worsening as described above. Two patients withdrew due to a local reversible rash at the injection site. Two patients withdrew due to increased muscle symptoms, one (PM) at month 3 and one (IBM) at month 6. Transient adverse events among the patients who completed the trial were: antibiotic treated respiratory tract (pneumonia in one), urinary tract and tooth infections in seven patients. Six patients had transient local skin reactions at the injection site.
Clinical and laboratory data
In the seven responders, physicians’ VAS improved by ≥20% in all; extramuscular global score improved by ≥20% in six; MMT-8 improved by ≥25% in two; HAQ and laboratory assessments improved by ≥20% in three; patient's VAS improved by ≥20% in four. FI improved by ≥20% in four. There was a correlation between MMT-8 and FI at month 6 among responders (p<0.05, R=0.9). All DM patients, but one, improved by ≥20% in the extramuscular mucocutaneous score. Detailed information on the IMACS'core set variables is presented in online supplementary table S3.
When comparing the baseline levels of the clinical and laboratory data between responders and non-responders, responders showed a higher value of MYOACT and extramuscular score at baseline compared with non-responders (p=0.002, p=0.007, respectively, figure 1A,B).

Responders had higher MYOACT (A) and extramuscular score (B) at baseline compared with non-responders. p Values are shown in the figures.
Two patients had changes in concomitant therapy. In one patient, MTX dose was reduced from 7.5 mg/week to 5 mg/week 10 months into the trial due to increased serum levels of liver enzymes, and another patient stopped prednisolone 1 month into the trial due to clinical improvement.
Muscle biopsy—cellular infiltrates, cytokines and MHC class I expression
Inflammatory infiltrates were present consistently in the first and last sections of the biopsies taken before and after 6 months treatment of the 14 patients for whom repeated biopsies were available. CD68 and CD163 expressing macrophages were detected in all pretreatment and post-treatment biopsies. T lymphocytes were detected in all but four biopsies, one pretreatment and three post-treatment biopsies. There was no significant change in the number of cells expressing CD3 or macrophage markers between the pretreatment and post-treatment biopsies, neither among responders nor non-responders.
IL-1α was expressed in inflammatory cells, endothelial cells of capillaries and large vessels in pretreatment biopsies of all patients. IL-1β was expressed in mononuclear inflammatory cells in 10 patients before treatment. IL-1α and IL-1β expression did not change significantly after 6 months treatment neither in responders nor in non-responders. IL-1Ra was detected in inflammatory cells in pretreatment biopsies of eight patients in total and in post-treatment biopsies of all responders, and in three of eight non-responders.
MHC class I expression in muscle fibres was detected in the pretreatment biopsy of nine patients. There was no significant change in MHC class I expression neither among responders nor non-responders. Information on muscle biopsy markers is presented in online supplementary table S3.
When correlating muscle biopsy findings with clinical outcome measures, there was an inverse correlation between the baseline CD163 macrophages and IL-1α expression and muscle performance (MMT and FI) after 6 months anakinra treatment (figure 2), but no correlation was shown with other investigated markers in muscles.

Correlations between inflammatory markers in muscle tissue and muscle performance of patients in our cohort. (A) Baseline CD163 macrophages in muscles correlated inversely with manual muscle test (MMT-8, max score 80) and (B) with functional index (FI) (displayed as percentage, max 100%) after 6 months treatment with anakinra. (C) Baseline IL-1α expression in muscles correlated inversely with MMT and (D) with FI after 6 months treatment. p Values and correlation coefficients are shown in the figures.
There was no difference at baseline between responders and non-responders concerning number of cellular infiltrates, cytokines and MHC-class I expression in muscle tissue.
Serum—IL-1Ra and G-CSF
Serum was available for 15 patients at baseline and 14 patients after 6 months treatment. The patients demonstrated high levels of serum IL-1Ra at baseline (median=1669 pg/ml, range 467–6937) compared with reported levels in healthy individuals (mean=354 pg/ml, range 11–839).42 No difference was found at baseline between responders and non-responders. As expected, this level was further enhanced after 6 months treatment (median=19 388 pg/ml, range 18 844–20 866, p=0.005, figure 3A), but without segregating responders and non-responders either. No correlation was shown with clinical response.

Serum levels of IL-1Ra and granulocyte colony-stimulating factor (G-CSF) before and after anakinra treatment. (A) Serum levels of IL-1Ra were significantly elevated after 6 months treatment with anakinra. (B) Serum levels of G-CSF were significantly lower after 6 months treatment with anakinra. p Values are shown in the figures.
Serum levels of G-CSF were significantly lower after 6 months anakinra treatment (median=9.43 pg/ml, range=2.9–31, compared with baseline levels median=21.0 pg/ml, range 5.47–61.5, p=0.005, figure 3B). A positive correlation was shown between baseline G-CSF and decreased CK levels after 12 months treatment (p=0.009, R=0.7), but not with muscle performance. G-CSF did not segregate responders from non-responders.
T cells—phenotype and functional assay
Viable cells from peripheral blood were available from eight patients at baseline and 6 months follow-up. One patient dropped out at month 1 and another dropped out at month 3. When we compared the data before and after 6 months treatment, these two patients were excluded.
Low levels of activated HLA-DR expressing T cells were detected at baseline (median=3.5%, range 1.4–7.5%), and remained stable at 6 months follow-up (median=3.1%, range 0.6–8.6%). When further dissecting the pool of naïve (CD45RO−) versus activated/memory (CD45RO+) T cells, all patients displayed more näive than memory CD8 T cells at both time points, and four out of six patients showed the same pattern for CD4 T cells. No difference was found between responders and non-responders. A strong negative correlation was seen between baseline levels of activated/memory CD4 T cells and decreased CK levels after 6 months (figure 4), but not with muscle performance.

An inverse correlation was observed between baseline frequency of CD4 CD45RO+ T cells in the blood and decreased creatine kinase (CK) levels after 6 months treatment, indicating that CD4 CD45RO+ T cells were negative predictors for response to anakinra. At Y-axis, % means the changed CK levels divided by pretreatment, minus indicates increased CK levels, while plus indicates decreased levels. p Values and correlation coefficient are shown in the figures.
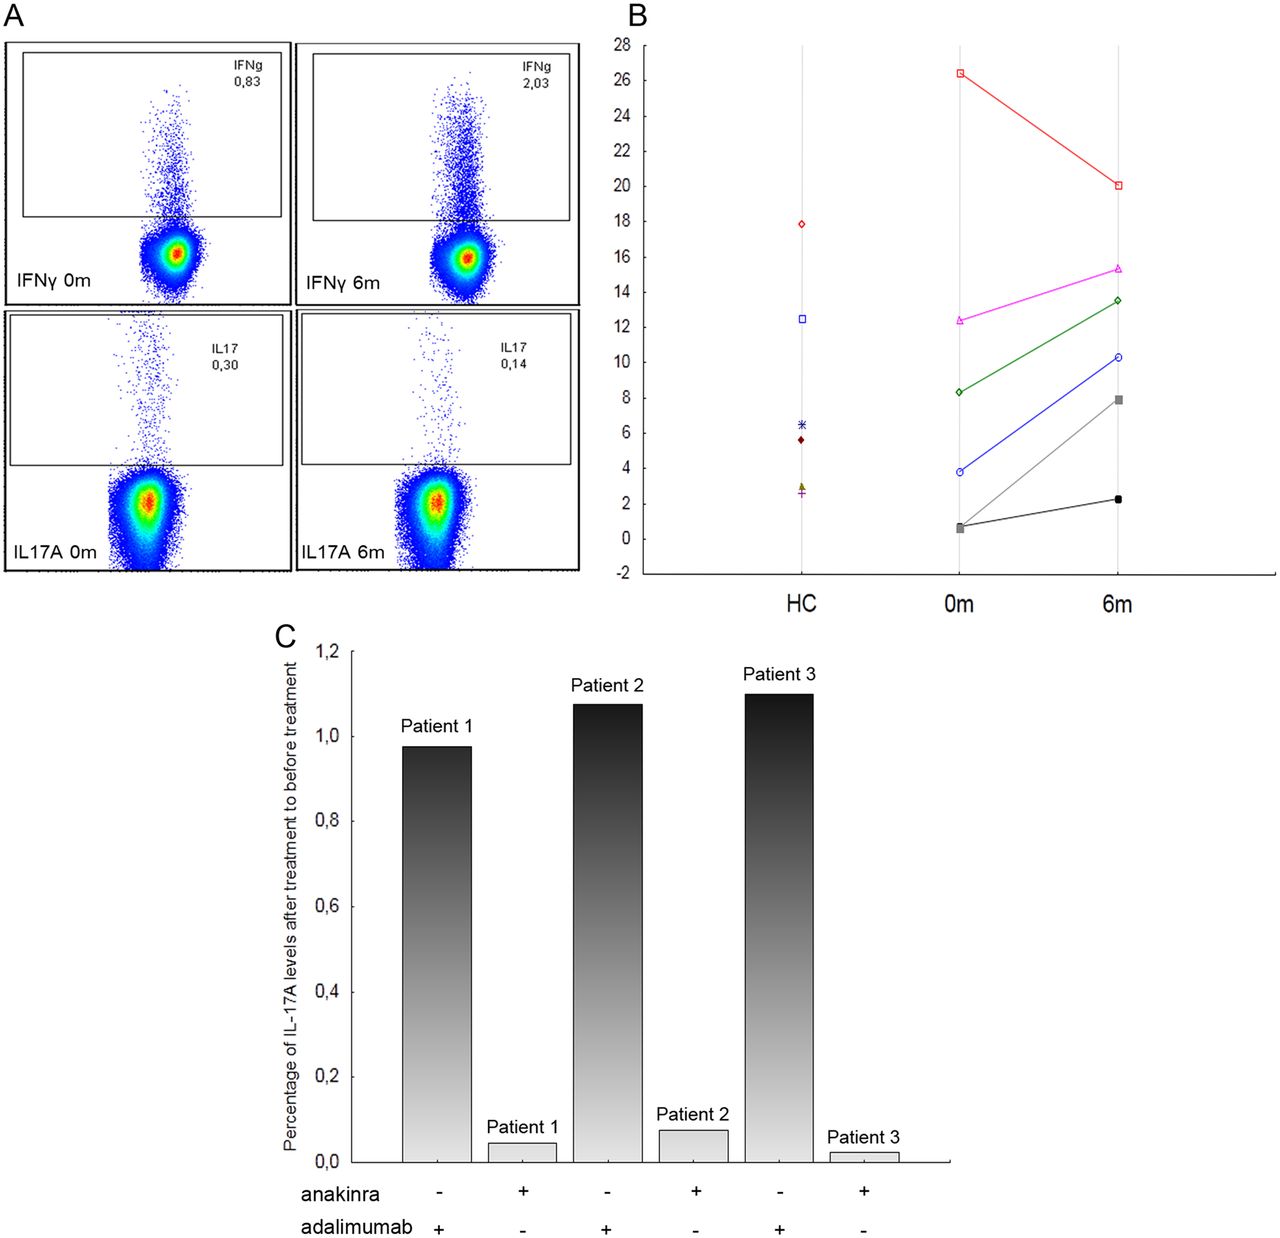
With regard to effector functions, we found low but detectable levels of IFNγ- secreting CD4 T cells at baseline (median=0.66%, range 0.08–4.96%). This level was higher in all patients after 6 months treatment (median=1.43%, range 0.16–8.29%). We also found low baseline levels of IL-17A-producing T cells (median=0.17%, range 0.04–0.4%), which was further reduced in three out of six patients after 6 months (figure 5A). When plotting the ratio of IFNγ to IL-17A for each patient, five of six patients increased the relative proportion of IFNγ over IL-17 secreting cells after treatment (figure 5B). To further substantiate this change, anakinra was added to in vitro cultures of PBMCs from three active myositis patients without anakinra treatment, IL-17A secretion was reduced by 92–98%, while adalimumab gave no effect (figure 5C). Hence, the role of anakinra in downregulating IL-17 in myositis was confirmed both in vivo and in vitro, but we did not find any difference between responders and non-responders or any relation to clinical response.
A shift of T cells in the blood from Th17 to Th1 after anakinra therapy. (A) Representative graphs from flow cytometry demonstrating increased frequencies of interferon (IFN)-γ and decreased frequencies of interleukin (IL)-17A secreting cells after treatment with anakinra. (B) Five of six investigated patients showed shifts in the ratio in favour of Th1 (IFNγ/IL-17A). The ratios from healthy controls (HC) are also shown in the figures. (C) In vitro, anakinra also decreased IL-17A levels in all three investigated patients, while adalimumab (tumour necrosis factor blockade) had no effects. Y axis is the percentage of IL-17A levels after anakinra/adalimumab treatment of before adding these treatments. All the cells were stimulated with anti-CD3.
After treatment, the levels of IFNγ- and IL-17A-producing CD4 T cells in patients in vivo were not different from healthy individuals (IFNγ-: median=1.63%, range 0.5–5%; IL-17A-: median=0.24%, range 0.19–0.4%), which can be seen on the IFNγ/IL-17 ratio in figure 5B.
Discussion
In this study, seven out of 15 patients with refractory myositis responded to treatment with anakinra according to IMACS definition of improvement. Furthermore, we found that: (A) clinically, patients with more extramuscular symptoms responded better to anakinra; (B) immunologically, CD163 macrophages, IL-1α in muscles and CD4 activated/memory T cells in blood might be negative predictors for anakinra response. Finally, we demonstrated that blocking IL-1 receptor reduced T cell differentiation into Th17.
An excellent clinical response to treatment with anakinra has preferentially been reported in patients with chronic autoinflammatory disorders, such as Still's disease and Muckle Wells syndrome.43–47 Concerning myositis, two case reports have previously been published suggesting a beneficial role of IL-1 blockade.48 ,49 Herein, we present effects of anakinra treatment on clinical outcome measures together with effects on peripheral blood cells and modest effects on muscle tissue in patients with refractory myositis.
The number of clinical responders in this study, seven of fifteen patients, is higher than we observed in our previous study using TNF-blockade (infliximab), in which some patients even flared during treatment and with increased interferon α activity.12 An unfavourable outcome of TNF-blockade in myositis has also been reported by other groups.13–15 This might indicate that myositis is more like an autoinflammatory disease rather than an autoimmune disease, but this needs further investigations.50
It should be noted that in our study, three out of the four DM patients improved in mucocutaneous extramuscular score, suggesting that anakinra has positive effects on skin rash in DM. This observation was also consistent with the finding that responders usually had higher extramuscular score at baseline comparing with non-responders. This could not be attributed to changes in ILD, as this was not a major problem in any of the included patients. Interestingly, one of seven responders was a patient with IBM. This patient had consistent clinical improvement at months 3 and 6, according to the core set of disease activity, and also improved in the FI test with sustained improvement up to month 12. This patient had typical clinical and histopathological features of IBM and was not different from the other IBM patients at baseline.
The three patients who worsened could be ascribed to the two core set measures, physician's VAS and extramuscular disease activity score, whereas, the muscle strength test MMT-8 did not worsen in any patient. One of the patients (PM) who worsened according to the disease activity score also worsened in FI after 12 months. The degree of worsening could probably reflect the natural course of disease in non-responders. There were no serious adverse events, and all adverse events present in the study are well known for anakinra. This suggests that anakinra was well tolerated among myositis patients.
We investigated some possible biomarkers for treatment response in muscle tissue and in peripheral blood. We could confirm expression of IL-1α in all patients and IL-1β in all but four muscle biopsies before treatment, supporting previous reports of IL-1 being consistently found in muscle tissue of myositis patients.17 ,18 ,20 ,21 ,23 Furthermore, a significant inverse correlation was shown between muscle IL-1α expression and muscle performance after 6 months treatment. IL-1Ra was detected in all post-treatment biopsies of all seven responders, but only in three of eight non-responders. However, the number of positive cells is very few in most patients. This may indicate that muscles are not the main resource of high serum IL-1Ra in the patients neither before nor after treatment.
Our study provided a possibility to investigate the effects of IL-1receptor blockade on T cell differentiation in vivo. We could observe a shift in T cell differentiation from Th17 to Th1, as indicated by more IFNγ and less IL-17A secreting T cells, which was further supported by in vitro observation. Our study is clearly limited by the low number of cell samples, but the role of IL-1 for Th17 development is now well accepted.51
Another limitation of our study is the open study design, which requires caution when interpreting results. Particularly, variables like physicians’ assessment of global VAS and extramuscular disease activity score could be affected, but, notably, the improvement of disease activity in four of seven responders was also substantiated by improvement of muscle performance according to the blinded measured FI, a partly validated outcome measure.34
The study cohort is heterogeneous including patients with PM, DM and IBM. The explanation being that IL-1 is consistently upregulated in muscle tissue of all three subsets, likewise all included patients had been refractory to previous immunosuppressive treatment.
In conclusion, anakinra treatment could be beneficial in a subgroup of patients with myositis; however, this has to be investigated in a placebo-controlled trial with IL-1 blockade. Such investigation may shed more light on the molecular mechanisms of anakinra and on the role of IL-1 in disease mechanisms in myositis.
Acknowledgments
We thank professor Per Renström for performing open muscle biopsies in some patients; Eva Lindroos for laboratory technical assistance; Christina Ottosson for coordinating the study; Elisabeth Berg and Anca Catrina for statistical advice. We also thank Patrick Merky, PhD, at Department of Clinical Neuroscience for the CBA assay help.
References
Supplementary materials
Supplementary Data
This web only file has been produced by the BMJ Publishing Group from an electronic file supplied by the author(s) and has not been edited for content.
Files in this Data Supplement:
- Data supplement 1 - Online table 1
- Data supplement 2 - Online table 2
- Data supplement 3 - Online table 3
Footnotes
Handling editor Tore K Kvien
MZ and ChD shared first authorship
-
Contributors All authors in this paper have taken at least some part in the idea inspiration, experimental design, data collection, data analysis, manuscript writing, or manuscript revision.
-
Funding This study was supported by grants from the Swedish Research Council, the Swedish Rheumatism Association, King Gustaf V 80 Year Foundation, Funds at the Karolinska Institutet, and through the regional agreement on medical training and clinical research (ALF) between Stockholm County Council and Karolinska Institutet and the Börje Dahlin foundation.
-
Competing interests None.
-
Patient consent Obtained.
-
Ethics approval This study was approved by the Local Ethics Committee at Karolinska University Hospital, Stockholm and all patients gave their informed consent to participate in the study.
-
Provenance and peer review Not commissioned; externally peer reviewed.