Article Text

Abstract
Objective This study was undertaken to assess the predictive ability of 4 established cardiovascular (CV) risk models for the 10-year risk of fatal and non-fatal CV diseases in European patients with rheumatoid arthritis.
Methods Prospectively collected data from the Nijmegen early rheumatoid arthritis (RA) inception cohort was used. Discriminatory ability for CV risk prediction was estimated by the area under the receiver operating characteristic curve. Calibration was assessed by comparing the observed versus expected number of events using Hosmer-Lemeshov tests and calibration plots. Sensitivity and specificity were calculated for the cut-off values of 10% and 20% predicted risk.
Results Areas under the receiver operating characteristic curve were 0.78–0.80, indicating moderate to good discrimination between patients with and without a CV event. The CV risk models Systematic Coronary Risk Evaluation (SCORE), Framingham risk score (FRS) and Reynolds risk score (RRS) primarily underestimated CV risk at low and middle observed risk levels, and mostly overestimated CV risk at higher observed risk levels. The QRisk II primarily overestimated observed CV risk. For the 10% and 20% cut-off values used as indicators for CV preventive treatment, sensitivity ranged from 68–87% and 40–65%, respectively and specificity ranged from 55–76% and 77–88%, respectively. Depending on the model, up to 32% of observed CV events occurred in patients with RA who were classified as low risk (<10%) for CV disease.
Conclusions Established risk models generally underestimate (Systematic Coronary Risk Evaluation score, Framingham Risk Score, Reynolds risk score) or overestimate (QRisk II) CV risk in patients with RA.
- Models Cardiovascular
- Arthritis Rheumatoid
- Cardiovascular Disease
Statistics from Altmetric.com
Introduction
Cardiovascular (CV) risk models are informative tools guiding preventive or therapeutic strategies by providing estimations of CV risk.1–5 In patients with rheumatoid arthritis (RA), the risk of CV disease (CVD) is increased and screening of CV risk factors and identification of high-risk patients is warranted.6 Risk algorithms developed for the general population do not necessarily perform well in the RA population, and may underestimate the increased risk in RA. The most widely used risk algorithms are; the Framingham risk score (FRS), the Systematic Coronary Risk Evaluation score (SCORE), the Reynolds risk score (RRS) and the QRisk II risk score.
The FRS has been developed and validated in American cohorts,7 including the General CV Risk Profile algorithm, which is the FRS adjusted to calculate the 10-year risk of fatal and non-fatal CVD.2 The original SCORE was developed and validated in 12 European cohorts to predict fatal CVD.1 Country-specific versions of the SCORE were developed to optimise prediction of the 10-year risk of CVD.8 ,9 SCORE and FRS are based on traditional risk factors. However, in patients with RA CV risk is not fully explained by these factors.10 Inflammation may account for the extra risk.11 In the general population inflammation has been shown to be an important independent CV risk factor.12 The RRS incorporates the inflammatory marker high-sensitivity C reactive protein (hs-CRP) in addition to traditional risk factors4 ,5 However, it is unclear if adding an inflammatory marker such as hs-CRP to a CV risk algorithm improves the predictive performance in RA as patients with RA may retain high levels of CRP during the course of the disease. The European League Against Rheumatism (EULAR) recommendations for CV risk management13 recommend the use of a multiplication factor of 1.5 to the risk score (a modified score, or M-SCORE) when a patients fulfils two out of three criteria; disease duration >10 years, rheumatoid factor or anticyclic citrullinated peptide positivity and presence of extra-articular manifestations. Recently, an updated version of the QRisk algorithm was developed by Hippisley-Cox et al.3 This QRisk II algorithm includes RA as an independent risk factor. However it is not known whether the M-SCORE, RRS and QRisk II risk algorithms predict future CV events in patients with RA more accurately compared with the SCORE or the FRS.
The predictive performance—that is, the accuracy of predictions of future CV event(s)—of these risk algorithms has not been evaluated and compared in European patients with RA. Therefore, the objective of this study is to assess the performance of four established CV risk algorithms (SCORE, FRS, RRS and QRiskII) for predicting the 10-year risk of fatal and non-fatal CV disease in European patients with RA.
Patients and methods
Study design and patients
This retrospective study is based on prospectively collected data from the Nijmegen early RA inception cohort. Patients were included at diagnosis of RA (baseline) in the outpatient clinic of the departments of rheumatology of the Radboud University Medical Centre (since 1985) or the Maartenskliniek in Nijmegen (since 1990). At inclusion, patients had a disease duration of <1 year, were disease modifying antirheumatic drug naïve and fulfilled the 1987 American College of Rheumatology (ACR) (inclusion before 2010) or ACR/EULAR 2010 criteria (inclusion after 2010) for the classification of RA.14 All patients provided written informed consent. Patients with a history of CVD before inclusion were excluded from our analysis. All four algorithms evaluated in this study can be used to calculate the 10-year risk of a CV event. Predicted risk for a CV event in patients with a follow-up time <10 years were adjusted proportionally, according to the length of actual follow-up and calculated as a proportion of 10 years.15
Data collection
Baseline characteristics were retrieved from the cohort database including; age (years), gender (male/female), rheumatoid factor positivity, anticyclic citrullinated peptide positivity, disease activity score 28-joints and CRP (mg/L). Data on CV risk factors at baseline were collected by medical chart and electronic patient file review, including smoking status (Y/N), blood pressure (mm Hg), use of statins (Y/N) and antihypertensive medication (Y/N), height (m) and weight (kg), diabetes mellitus (Y/N), hypertension (Y/N) and family history of CVD (Y/N). Lipid levels were measured using serum from frozen samples collected at baseline. Non-fasting total cholesterol and high-density-lipoprotein cholesterol concentrations (mmol/L) were measured using laboratory facilities of Russells Hall Hospital, Dudley UK.
Primary outcome
The primary outcome is the first CV event (fatal and non-fatal), which were retrieved from physician diagnosis and extensive review of medical charts and electronic patient files. Included CV events were: acute/unstable coronary syndrome (myocardial infarction and unstable angina pectoris), stable angina pectoris, cerebral vascular accident (CVA), transient ischaemic attack, peripheral vascular disease and heart failure. Deaths due to CVD were verified from death certificates, provided by Statistics Netherlands,16 including deaths due to CVD and CVA but excluding cerebral haemorrhage and non-coronary cardiac death (ie, arrhythmias). As every CV risk model has its own set of predicted outcomes, four separate outcome variables were constructed specifically adjusted to fit the models.
Risk algorithms
All risk algorithms included gender, smoking, total cholesterol:high-density-lipoprotein cholesterol ratio and systolic blood pressure. The 10-year general FRS for CVD2 the SCORE9 and RRS4 ,5 were calculated using the published risk algorithms. The SCORE that was used is the Dutch version adapted to predict fatal and non-fatal CVD.9 ,17 The QRisk II risk algorithm also includes diabetes (Y/N), atrial fibrillation (Y/N), blood pressure treatment (Y/N), RA (Y/N), body mass index (weight (kg)/height (m)2), family history of CVD, chronic kidney disease and the Townsend deprivation score.3 The latter was not available in our cohort. Therefore, CV risk was calculated using an adjusted QRisk II algorithm excluding this variable, courtesy of ClinRisk. The M-SCORE was considered but not used because in this inception cohort it would apply only to a very small number of patients (n=23).
Statistical analysis
Baseline data were used to calculate individual risks for CV events within 10 years for all four CV risk algorithms. Missing values were imputed using multiple imputations with five repetitions. The discriminatory ability of the four algorithms was estimated using the area under the receiver operating characteristic (ROC) curve, which is similar to the concordance-statistic (c-statistic).18 An area under the ROC curve of 1 signifies perfect discriminatory ability and an area of 0.5 indicates the prediction model does not perform better than a random guess. Calibration was assessed by comparing the agreement between observed and predicted (calculated by the CV risk algorithms) number of CV events (%) in groups of patients stratified in deciles of the predicted risk. Hosmer-Lemeshow (H-L) tests and calibration plots were used. In the calibration plots, a line was fitted between the observed and predicted probabilities of a CV event per decile of predicted risk using quadratic spline. Sensitivity and specificity were calculated for the cut-off values of 10% and 20% that mark the difference between low-risk and intermediate-to-high risk and between low-intermediate risk and high-risk patients, respectively. These cut-off points are recommended in guidelines to be used as indicators for CV preventive treatment; lifestyle adjustments and drug therapy interventions. In this cohort, regular CRP was measured, but values <5 mg/L were not quantified. These values were imputed as 2.5 mg/L. A sensitivity analysis was performed for CRP values below 5 mg/L using either 0 or 5 as alternatives for values <5 mg/L. All statistical analyses were performed using SPSS V.20.0.
Results
Patients
In total, 1157 patients were enrolled of which 107 patients experienced a CV event prior to the diagnosis of RA, leaving 1050 patients with 9957 patient-years for analysis. During follow-up, 149 patients developed a first CV event (1.14 events per 100 patient-years); 67 cases of acute/unstable coronary syndrome (myocardial infarction or unstable angina pectoris), 24 cases of stable angina pectoris, 26 CVAs, 10 transient ischaemic attacks, 18 cases of peripheral vascular disease and 4 cases of heart failure. Out of all these events, 15 were fatal. The primary outcome was adjusted to fit each CV risk algorithm,2–5 ,9 leaving 104, 149, 87 and 126 first CV events for analysis of SCORE, FRS, RRS and QRisk II, respectively. As the RRS is not applicable to patients with diabetes, these patients (n=44) were excluded, leaving a total of 1006 patients for analysis of the RRS. Patient characteristics for all (n=1050) patients with RA are presented in table 1. Missing values ranged from 0.1% to 10.3% at baseline for variables included in the models.
Patient characteristics
Discrimination
Discriminatory ability was comparable across the four CV risk models. Overall, discriminative ability was good; c-statistic scores of 0.78 (95% CI 0.74 to 0.82), 0.80 (95% CI 0.77 to 0.84), 0.78 (95% CI 0.73 to 0.82) and 0.79 (95% CI 0.75 to 0.83) for the SCORE, FRS, RRS and QRisk II, respectively. The corresponding ROC curves are presented in figure 1.

Receiver operating characteristic (ROC)-curves for the different risk algorithms. Area under the curve (AUC)-values (95% CI) are 0.78 (0.74 to 0.82), 0.80 (0.77 to 0.84), 0.78 (0.73 to 0.82) and 0.79 (0.75 to 0.83) for the Systematic Coronary Risk Evaluation (A), Framingham risk score (B), Reynolds risk score (C) and QRisk II (D), respectively.
Calibration
Across deciles of predicted CV risk there were discrepancies between the observed and predicted (calculated risk scores) number of CV events for all four algorithms (figures 2 and 3). CV risk predictions calculated using SCORE appear to deviate from the observed CV risk in the middle and top deciles, particularly when CV risk is underestimated (figures 2A and 3A). The H-L test yielded a p value of <0.001, indicating poor model fit. The number of CV events predicted by the FRS were similar to the observed number of CV events, showing a modest difference in predicted and observed CV risk in the lower and middle deciles. The predicted number of CV events in the top two deciles showed a more pronounced deviation from the observed number of CV events, under- and overestimating CV risk. The H-L test indicated poor model fit with a p value of 0.024 (figures 2B and 3B). Overall, the CV risk as predicted by the RRS is not in concurrence with the observed CV risk, underestimating the number of CV events (figures 2C and 3C), with an overall p value of 0.020 of the H-L test indicating poor model fit. The QRisk II mainly overestimated observed CV risk. The H-L test result indicated moderate model fit with a p value of 0.20 (figures 2D and 3D). Overall, the number of CV events that were expected based on the risk calculated by these algorithms appeared to be an inaccurate estimate of the observed number of CV events in patients with RA.
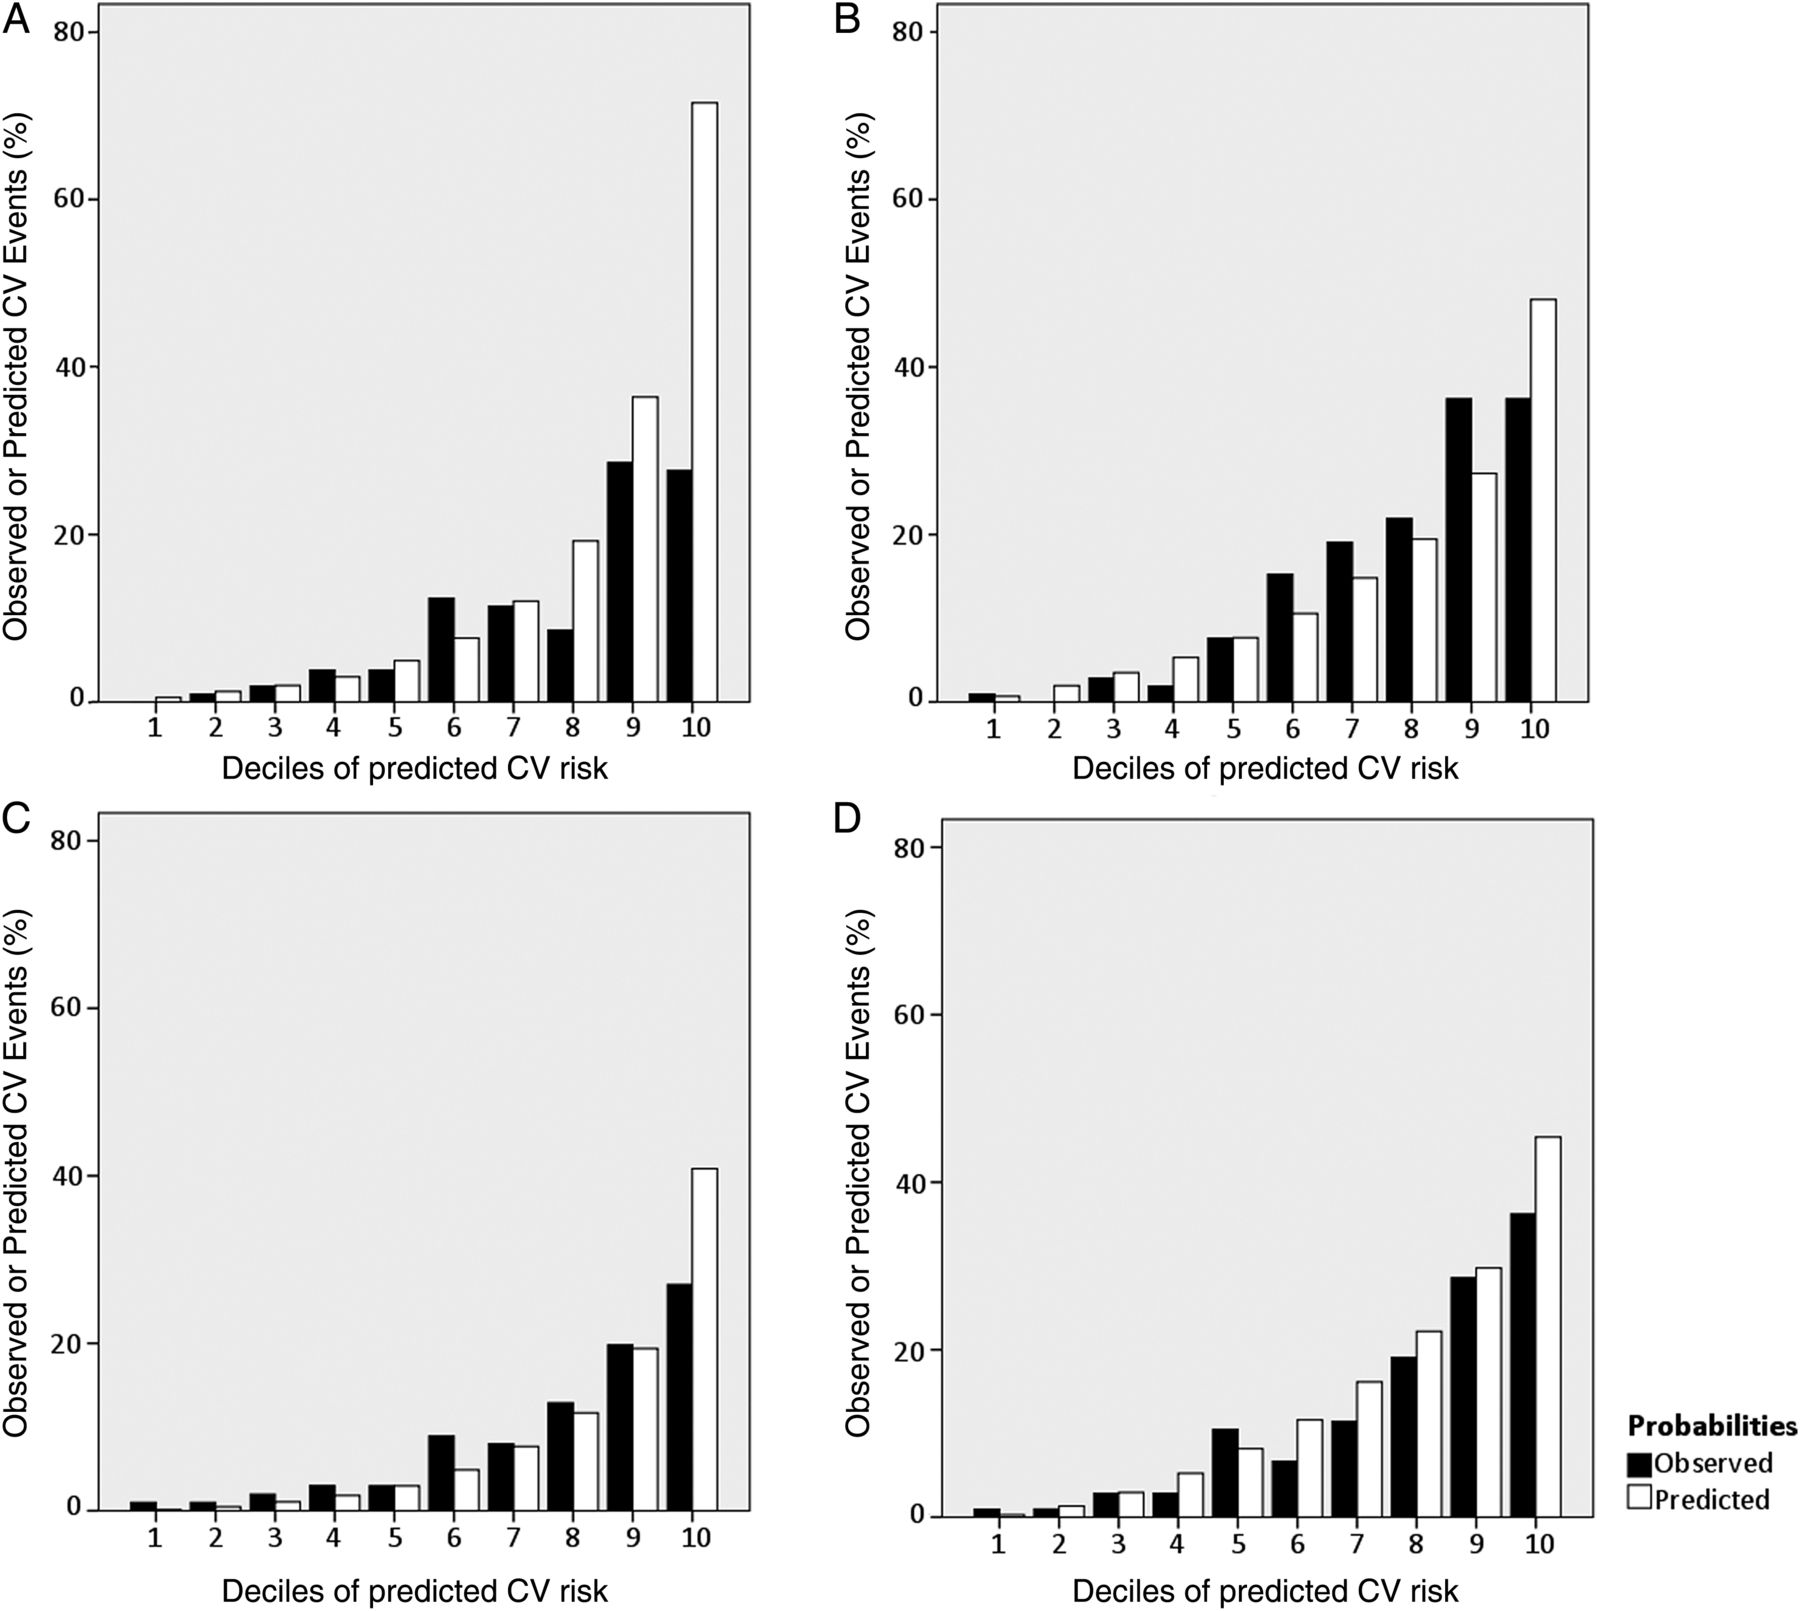
Observed (closed bars) versus predicted (open bars) cardiovascular (CV) events (%) in deciles of predicted risk, for the Systematic Coronary Risk Evaluation (A), Framingham risk score (B), Reynolds (C) and QRisk II (D) risk algorithms.

Calibration plots for the observed versus predicted probabilities for the 10-year risk of cardiovascular disease (CVD) of the Systematic Coronary Risk Evaluation (A), Framingham risk score (B), Reynolds (C) and QRisk II (D). The dotted line represents the relationship between the observed and predicted probabilities for CV events per decile. The solid line is the line of perfect agreement. Ideally, all points connect with this line, signifying perfect agreement between observed and predicted probabilities, that is, between observed and predicted CV risk.
Sensitivity and specificity
Sensitivity and specificity of the 10% and 20% cut-off points for CV risk are presented in table 2. Also shown in this table are the positive and negative predictive values. The negative predictive value ranges from 92% to 97% depending on the model and the cut-off point, which indicates that out of all patients classified as being ‘low risk’, a relatively small number of patients did develop a CV event. When considering the total number of CV events, varying from 87–149 depending on the model, up to 24% (SCORE) and 32% (RRS) of first CV events occurred in patients with RA who were classified as ‘low risk’ (<10%).
Sensitivity and specificity of cut-off points in CV risk scores
Discussion
The risk estimations from the four evaluated CV risk algorithms deviate from the observed risk; overestimating (QRisk II) and underestimating (SCORE, FRS, RRS) the risk of future CV events in European patients with RA. This underestimation was most pronounced in the lower two-thirds of predicted CV risk, in line with the underestimation of CV events by FRS and RRS in patients with RA from northern America.15 Moreover, the Low-to-intermediate range of CV risk is most clinically relevant, as preventive interventions are recommended if CV risk exceeds 10% or 20%. The risk models discriminated relatively well, with areas under the ROC curve of 0.78–0.80, indicating moderate to good discrimination between patients with and without a CV event. Calibration of all four algorithms was poor to moderate, particularly in the clinically relevant low and intermediate ranges of risk. Out of all ‘low risk’ patients a relatively small number of patients developed a CV event. However, these patients still accounted for up to 32% (RRS) of all CV events and as these patients were classified as ‘low risk’ (underestimation) it is unlikely that they received any preventive treatment.
When comparing the predictive performance of the four algorithms in patients with RA with the predictive performance reported in the general population, discriminative ability appears comparable.3 ,5 ,9 ,19 However, in the RA population these models appear to perform less well in terms of calibration, considering the large discrepancy between observed and predicted CV number of events observed in this study. In the Netherlands, assessment of the SCORE risk model for the prediction of 10-year CV mortality and morbidity showed a slight overestimation of CV risk and relatively good discriminative ability with a c-statistic score of 0.75 in men and 0.71 in women.9 In an American cohort, the FRS showed relatively high discriminative ability (c-statistic score of 0.76 and 0.79 for men and women, respectively) and good calibration (H-L test p value of 0.14) indicating moderate model fit.2 The RRS showed good discrimination and calibration in the general population as well, with a c-statistic score of 0.81 and H-L test p value of 0.61.4 The QRisk II algorithm generated similar results in a large British cohort with a c-statistic of 0.79 and 0.82 for men and women, respectively, and good calibration.3 These results were not achieved in the RA population of this study. This is in concurrence with a recent study by Crowson et al,15 evaluating the RRS and FRS in 525 North American patients with RA without prior CVD reporting that both risk algorithms underestimated CV risk. The relative importance of traditional CV risk factors that form the foundation of these algorithms may be different in patients with RA. The selection of risk factors and the relative weight of each factor in these risk algorithms may not be a good representation of the predicting risk factors for CVD in patients with RA.
In order to better identify patients at risk, different approaches have been proposed. First, the cut-off points in CV risk used as indications for primary prevention could be adjusted. However, this could also lead to overtreatment as the majority of patients in the lower risk group do not develop events. Alternatively, a correction factor could be used to adjust the CV risk in patients with RA, as was suggested by the EULAR recommendations for CV risk management.13 There are no data supporting such a multiplicator; it was based on expert opinion. Few patients in this cohort fulfilled two out of the three criteria (n=23) as none of the patients had a disease duration >10 years at baseline, and this model was therefore not regarded for analysis. Recent data suggests that patients with RA may have similar chances to develop CV events early and late in their disease course.20 ,21 Another approach is the addition of RA-specific risk factors to the risk algorithm. The RRS includes CRP, a variable indicative for disease activity in RA. CRP has been associated with atherosclerosis and CVD in the general population and in the RA population.22–27 Adding this variable to a CV risk model could therefore improve predictive performance. However, results of this study showed that the RRS provided similar or slightly less accurate CV risk predictions in patients with RA, compared with other models that do not include CRP. Regular CRP was used to calculate CV risk with the RRS algorithm whereas hs-CRP is indicated,4 ,5 which could have affected the predicted probabilities. However, sensitivity analysis for CRP values <5 mg/L showed no different outcomes when setting these values at either 0 mg/L or 5 mg/L (not shown). Future research is necessary to determine whether other RA-specific baseline components that better reflect future disease activity may improve CV risk prediction. However, simply adding disease specific parameters may not be sufficient to boost model performance without further adjusting the risk algorithm and its predictors to the RA population. Interestingly, the FRS which was developed in the US population, appears to perform better than SCORE in this cohort of European patients, with the lowest number of patients falsely classified as being ‘low-risk’. Whereas the included risk factors and predicted outcomes are quite similar between the SCORE and FRS, the relative weights attributed to the different risk factors do differ between both risk models. An explanation for the results found may be that the Dutch patients with RA bear a better resemblance to the US general population (with an increased CVD burden compared with the Dutch) than to the Dutch general population, in terms of their CV risk profile.
Several strengths and weaknesses of this study should be considered. The hs-CRP measurements were not available in this cohort which could have affected RRS performance. However, as described in the previous paragraph regarding the sensitivity analysis, this is unlikely. It was not possible to directly compare model performance between this RA cohort and a cohort of age-matched and gender-matched healthy controls. Further, these results may not be generalisable to patients with long-standing disease as an inception cohort was used. Also, the adjustment of risk scores in patients with a follow-up <10 years, may provide an inaccurate estimation if CV risk changes during the course of RA. However, evidence from our cohort suggests the risk is equal across the 10 years.28 A strength of this study is the prospective data collection with minimal missing data. This study compares a large number of algorithms, all in the same RA cohort, which provides a comprehensive overview of CV risk model performance in patients with RA.
In conclusion, the SCORE, RRS, FRS and QRisk II algorithms tend to either underestimate or overestimate CV risk in a large portion of the RA population and provide less accurate predictions of CV risk in the RA population, compared with results reported in the general population. Underestimating CV risk may lead to insufficient treatment of (traditional) CV risk factors. Perhaps, a RA-specific CV risk model could improve CV risk prediction in patients with RA. The performance of a RA-specific CV risk model should be compared with the performance of the current risk algorithms.
Acknowledgments
The authors thank Cynthia Crowson from the Department of Health Sciences Research, Division of Rheumatology, Mayo Clinic, Rochester, Minnesota and Stephen Hippisley-Cox from ClinRisk, West Yorkshire, UK, for their very important contributions.
References
Footnotes
Handling editor Iain McInnes
-
Contributors All authors have given substantial contribution to the conception and design and/or analysis and interpretation of the data, have drafted and/or revised the manuscript critically for important intellectual content and given final approval of the version to be submitted for publication. EEAA had full access to all of the data in the study and takes responsibility for the integrity of the data and the accuracy of the analysis.
-
Competing interests EEAA: was partially funded by the Rheumatology Research University Nijmegen foundation. AS has received speaker honoraria and/or consulting fee from Merck/Schering-Plough, Abbott, BMS, Pfizer/Wyeth, Genentec and Hoffman-La Roche. GDK has served as a consultant UCB and Astra-Zeneca, received honoraria from Abbott, UCB and Pfizer, and received research grants from Pfizer. PvR has received travel grants and advisory board fees from Abbott, Pfizer, Roche and UCB.
-
Ethics approval Approved by the responsible medical ethics committee, CMO Arnhem Nijmegen.
-
Provenance and peer review Not commissioned; externally peer reviewed.