Article Text

Abstract
Objective: To compare work disability, sick leave, and productivity costs due to ankylosing spondylitis (AS) of three European countries.
Methods: 216 patients with AS from the Netherlands, France, and Belgium participated in a two year observational study. Employment and work disability rates at baseline were adjusted for age and sex. Productivity costs were calculated by both the friction cost method and the human capital approach. The adjusted contributions of country to employment, work disability, and having an episode of sick leave were assessed by logistic regression and the contribution of the country to days of sick leave and costs by Cox proportional hazard analysis.
Results: 209 patients completed the two years' follow up with sufficient data for cost analysis. Adjusted employment was 55% in the Netherlands as compared with 72% in both other countries and only in the Netherlands was it lower than expected in the general population. Adjusted work disability was 41%, 23%, and 9% in the Netherlands, France, and Belgium and in all countries was higher than expected in the general population. In those with a paid job, the mean number of days of sick leave per patient per year because of AS was 19 (range 0–130), six (range 0–77), and nine (range 0–60 ) in the Netherlands, France, and Belgium respectively. Applying the friction cost method to those with a paid job resulted in mean costs per patient per year of 1257 euros (range 0–7356), 428 euros (range 0–5979), and 476 euros (range 0–2354) in the Netherlands, France, and Belgium. Applying the human capital approach to the whole group resulted in mean costs per patient per year of 8862 euros (range 0–46 818), 3188 euros (range 0–43 550), and 3609 euros (range 0–34 320) in the three countries, respectively. After adjusting for sociodemographic and disease characteristics, living in the Netherlands, as compared with both other countries, was associated with a higher chance of being work disabled (odds ratio (OR)=3.82; 95% confidence interval (CI) 1.33 to 11.01), but not with the risk of having an episode of sick leave. Similarly, living in the Netherlands contributed independently to the number of days sick leave (OR=0.65; 95% CI 0.43 to 0.97), a higher amount of friction costs (OR=0.63; 95% CI 0.42 to 0.96), and a higher amount of human capital costs (OR=0.46; 95% CI 0.32 to 0.68).
Conclusion: There are remarkable differences in work status and productivity costs between the three European countries. This has implications for the generalisability of health economic studies.
- ankylosing spondylitis
- employment
- costs
- economic analysis
- ANOVA, analysis of variance
- AS, ankylosing spondylitis
- B, Belgium
- BASDAI, Bath Ankylosing Spondylitis Disease Activity Index
- BASFI, Bath Ankylosing Spondylitis Functional Index
- CI, confidence interval
- EQ-5D, EuroQol 5 dimensions instrument
- F, France
- FC
- friction costs
- HC, human capital
- IBD, inflammatory bowel disease
- NL, the Netherlands
- OR, odds ratio
- QoL, quality of life
- RA, rheumatoid arthritis
Statistics from Altmetric.com
- ANOVA, analysis of variance
- AS, ankylosing spondylitis
- B, Belgium
- BASDAI, Bath Ankylosing Spondylitis Disease Activity Index
- BASFI, Bath Ankylosing Spondylitis Functional Index
- CI, confidence interval
- EQ-5D, EuroQol 5 dimensions instrument
- F, France
- FC
- friction costs
- HC, human capital
- IBD, inflammatory bowel disease
- NL, the Netherlands
- OR, odds ratio
- QoL, quality of life
- RA, rheumatoid arthritis
Economic end points are increasingly important in observational and clinical studies. Costs due to loss of productivity, also referred to as indirect costs, are an important part of the total costs of chronic rheumatic diseases.1–7 In rheumatoid arthritis productivity costs account for 25–71% of the total costs,3,7–11 varying between $1467 and $37 501 per patient per year (after conversion of all figures to 1996 American dollars).3,4,7–12 Economic end points are not only influenced by patient and disease characteristics but also by international differences in medical practice and differences in finance and organisation of health care and social security systems.13 Methodological aspects of comparability of health economic analyses among countries have received little attention. This is surprising given the potential impact of the findings.
Ankylosing spondylitis (AS) is a chronic rheumatic disease that can lead to important functional limitations not only because of spinal disease but also because of extraspinal disease. The condition usually starts in the third decade of life. In Western Europe its prevalence is estimated at 0.075–0.85%.14,15 Men are affected three times as often as women. In a cross sectional study of 658 Dutch patients with AS, we have shown that labour force participation was 11% lower and AS related work disability 15% higher than in the general population. In those with a paid job the mean number of AS related days sick leave per patient was 10 days a year.16 In the present study we focused on international differences in work disability and sick leave in AS in three European countries: the Netherlands (NL), France (F), and Belgium (B). Further, we compared productivity costs of AS and assessed its determinants in an international perspective.
PATIENTS AND METHODS
Patients
Patients were selected from the rheumatology departments of four hospitals in three countries: the University Hospital Maastricht and the Maasland Ziekenhuis Sittard in the Netherlands, Hospital Cochin, Paris in France, and the University Hospital, Ghent in Belgium. In the Netherlands, all patients who were registered with the diagnosis AS in the Dutch standard diagnosis register of rheumatic diseases were sampled.17 In Belgium, consecutive outpatients and in France consecutive out- and inpatients with AS were sampled during a preset time of six months. Plain films of the sacroiliac joints of all patients were checked to ascertain they fulfilled the modified New York criteria for AS. The hospitals of Maastricht, Paris, and Ghent have a regional and referral (academic) function. Sittard is a regional hospital cooperating in research projects with the University Hospital Maastricht. In all three countries traditionally patients with a chronic rheumatic disease are referred to a rheumatologist. Patients were included between September 1996 and March 1997 and were followed up for two years. The last follow up patient for this part of the study was evaluated in April 1999.
Questionnaires
At baseline and every six months patients underwent a clinical examination and completed questionnaires assessing sociodemographic data (which included work status) and disease characteristics, including AS-specific physical function measured by the Bath Ankylosing Spondylitis Functional Index (BASFI) (range 0–10; higher values indicating worse function).18 In addition, every two months patients filled out an economic questionnaire on AS related health resource use in the past two months, the Bath Ankylosing Spondylitis Disease Activity Index (BASDAI), measuring AS-specific disease activity (range 0–10; higher values indicating higher disease activity)19 and the EuroQol, a generic quality of life (QoL) measure (maximum value 1; higher values indicating better QoL).20,21 Economic questionnaires were adapted for each country according to the language, educational system, income, possible categories of work status, currency, social security system, and health insurance system. To estimate gross monthly income, 10 predefined categories were given (each with a range of 500 euros) as well as the possibility of providing the exact income. For classification of profession, a list of 26 possible professions in seven categories, as used by Statistics Netherlands, was applied.22 For the purpose of statistical analysis educational level was dichotomised into more than 12 years' formal education as opposed to 12 years or less, whereas professions were divided into manual jobs (in the agricultural, industrial, and transport sector) and non-manual jobs (in the administrative, commercial, servicing, and specialist/managerial sector).
Definition of outcome measures
This cost-of-illness analysis was designed as a prevalence based, prospective, disease specific (AS related) study from a societal perspective, using patient derived data. Productivity costs refer to the societal costs associated with loss of paid production and not to loss of unpaid production or loss of leisure time. The active population refers to those aged between 16 and 65 years who are working or willing to work. Consequently, the elderly in retirement, students, and housewives are excluded from this group, but those economically unemployed or work disabled are included. Work disability is defined as an officially recognised inability to perform paid work because of AS according to the criteria of each country.
The three countries have had social security legislation since the first half of the last century. In the Netherlands, no medical certification is required for sick leave. Since 1996,23 the payment of sickness benefit is the responsibility of the employer during the entire first year of sick leave and varies between 80% and 100% (depending on the employment contract) of the former gross wage. After three months of sick leave the occupational physician of the employer starts a rehabilitation plan and part time work can be part of this. After one year of continuous sick leave, the Social Security Association, an official government organisation, can grant permanent (full or partial) work disability where there are objective medical restrictions to performing paid work. Seven categories of work disability exist and disability between 80% and 100% is regarded as full disability, while the other categories are considered as partial work disability. When the percentage of disability exceeds 15% a benefit will be allowed ranging from 25% to 70% of the former gross wage. The percentage of work disability and associated benefit are based on the restriction to earning the wage of the last or a comparable job. Patients with partial work disability are encouraged to continue working in a part time job. The period of attributed disability is restricted to a maximum of five years. After this period reassessment of disability is obligatory.
In France, medical certification for sick leave is required. The sick leave benefit is paid from the fourth day onward and is 50% of the mean gross wage during the first month and 66% afterwards. The maximum duration of sick leave is one year, although in exceptional conditions, such as chronic diseases, sick leave can be as long as three years. During this period, the expert of the Social Security Insurance can allow part time work. After one (or three) years of sick leave, work disability (disability pension) can be allocated by a committee of expert doctors (designated by the Social Security Insurance and COTOREP, a Social Security Organisation committee) if the person can earn only 33% or less of his income. When the person is considered to be able to carry out (part time) work, a disability benefit of 30% of the former gross wage is allocated. When the person is considered to be unable to perform paid work, a disability benefit of 50% of the former gross wage is granted (with a minimum and a maximum level and a supplement if others depend on this person).
In Belgium, medical certification for sick leave is required. When sick leave lasts less than 14 days, the sickness benefit starts on the second day and is 100% of the gross wage for the first eight days of sick leave and 85% for the second week. When sick leave lasts longer, the sickness benefit is 100% during the first week, 85% during the second week, and 60% afterwards. Part time work during this period is only exceptionally allowed. After a maximum duration of one year's sick leave, the expert doctor of the Social Security Organisation can grant permanent work disability if the person is restricted to 33% to perform any job (on the general labour market). If work disability is attributed, part time work is only exceptionally possible. The disability benefit ranges from 45% to 60% of the former gross wage. The social security system for those employed by the government is slightly different. The sickness benefit starts from the first day of sickness and is 100% of the gross wage for 30 days. After that period, eligibility for disability is judged according to the same criteria as described for other employers. The disability benefit is 80% of the gross wage.
In all countries, people who are self employed receive a sickness or disability benefit only after private insurance. Reinsurance against income loss because of sickness or work disability is possible in all countries for people with a paid employment.
Reference data from the general population
National figures on population size for each age and sex category, employment, unemployment, work disability, days of sick leave, income, educational level, professional class, and national expenditure on social security were retrieved from Eurostat for 1997 and 1998.24 In addition, to obtain missing data or for reasons of comparison, the OECD 2000 Health Data CD-ROM, several internet sites providing information on national and European statistical data, and the internet sites of the Ministries of Health Care and/or Social Affairs of the three countries were consulted.
Cost estimation
Two methods of calculating productivity costs were used: the friction costs method (FC) and the human capital approach (HC).25 At the time of the study (1998) the length of the friction period in the Netherlands was set at four months.26 The FC method limits the time of productivity loss to the period of sick leave until replacement of the worker has taken place (friction period). The friction period largely depends on the unemployment rate. The HC method includes productivity costs from the first until the last day of absence from work and productivity costs from the first day of work disability until the last day of work disability or legal age of retirement. For both methods the production value per work day was calculated for each patient based on incident self reported gross wage per month (if applicable, adapted for the number of contractual work days per month and the income out of work disability according to the specific benefit scheme of each country). If questionnaires assessing days absent at work were missing, the mean number of days absent for the other periods in the same patient was used. If the income of the patient was missing, the mean of other patients of the same sex, age category, professional class, work status, and country was used. All costs are calculated in euros. On 31 December 1998 the euro was equivalent to 2.20 Dutch guilders, 6.56 French francs, and 40.34 Belgian francs. At that time 1 euro was equivalent to $1.17.
Statistics
Results are presented for patients completing two years of follow up and who filled out at least nine of 12 bimonthly questionnaires. Demographic and disease characteristics and socioeconomic status are presented using descriptive statistics. Overall differences among countries were tested by χ2 for proportions or by one way analysis of variance (ANOVA) for parametric variables. When the overall differences among countries was significant at the 0.05 level, the level of significance between two countries was sought by χ2 for proportions or ANOVA with least significant difference for parametric variables.
Baseline employment and work disability rates are calculated as raw rates and were adjusted for age and sex using the general population of each country as reference. Direct standardisation was chosen because rates for part time employment and work disability for the required age and sex categories (necessary for indirect standardisation) were not available for all countries.
Sick leave and productivity costs are presented as means and ranges. The differences between countries are presented as mean difference with the 95% CI assessed by bootstrapping with 10 000 replications.27–29
To evaluate if a country remains a significant contributor to the risk of incurring an episode of sick leave or work disability after adjusting for baseline differences in patient characteristics, logistic regression analyses with backward elimination according to the likelihood ratio test were performed (probability for removal 0.1). Similarly, Cox proportional hazard regression with backward elimination with days of sick leave or amount of costs as dependent variable was used to assess the contribution of a country to the length of sick leave or the level of costs. For FC and HC costs Kaplan-Meier survival curves were computed. The populations used for the regression analyses were those at risk for the outcome studied: (a) those with a paid job when sick leave or FC was the outcome (n=113) and (b) the active population (n=186) when work disability or HC costs were the outcome. Independent variables in all models were age, sex, education, profession, disease duration (since diagnosis), presence of inflammatory bowel disease (IBD), presence of peripheral arthritis, time averaged disease activity (BASDAI), physical function (BASFI), and country (dummy).
Finally we explored (a) if sick leave or work disability resulted in a worse QoL measured by the EuroQol 5 dimensions instrument (EQ-5D) and (b) if this effect was different among the countries studied. Multiple Cox proportional hazard regression analysis with EQ-5D as dependent variable was used, because the distribution of the values of the EQ-5D was skewed. As independent variables sex, age, educational level, disease duration, IBD, peripheral arthritis, country (dummy), and work disability or sick leave (in those with a paid job) were entered in a backward elimination regression analysis. Possible interactions between country and work disability or sick leave were sought.
Sensitivity analysis
Among health economists the FC method is considered to reflect best the societal productivity costs and was therefore chosen for the reference case.30,31 In order to adjust for several assumptions that were made in calculating the reference case, sensitivity analyses were performed. Firstly, FC were extended for total and not exclusive AS related sick leave. Secondly, costs were reanalysed when questionnaires were missing by considering the number of days of sick leave to be equal to no sick leave and also by assuming the patient was on sick leave during the entire missing period. Thirdly, the length of sick leave in patients who were absent from work for six months or longer during the two years of follow up was replaced by the mean duration of sick leave in the remaining patients of that country, and in a following analysis the same was done for patients reporting more than three months of sick leave. In a last sensitivity analysis, country-specific production values (adjusted for part time work or partial work disability for each individual patient) were used instead of patient reported income. Eurostat data on income per working day as well as data from each country's national bureau of statistics were used because data differed according to the different sources.
RESULTS
Patients
In total, 135 Dutch, 54 French, and 27 Belgian patients with AS started the study. Of the initial 137 Dutch patients, sampled from the standard diagnosis register of rheumatic diseases, two did not fulfil radiological criteria for AS and were therefore not included. In the course of the two years' follow up, five Dutch, one French, and one Belgian patient dropped out of the study. Of the five Dutch patients who ended the study prematurely, one was a housewife, one an elderly retired man, and the other three were male patients with full work disability because of AS. The French patient was a 39 year old man with a part time job and partial work disability. The Belgian patient was a 34 year old woman working full time. All patients who completed the two years' follow up had answered at least nine of 12 questionnaires. Table 1 presents the sociodemographic characteristics of patients who completed the study. Dutch patients were somewhat older, had on average a lower educational level, and reported worse physical function (BASFI). Belgian patients less often had peripheral arthritis. Of the French patients, fewer had a manual job and none of these patients had concomitant inflammatory bowel disease.
Baseline characteristics of patients with AS completing the study
Work status and sick leave
Table 2 presents the baseline socioeconomic status of all completers. Including the patients with incomplete follow up did not change the results significantly (maximal difference of 1% with the presented figures, data not shown). Employment in NL is lower and work disability higher than in both other countries (χ2, p<0.05). In the course of the two years' follow up, one Dutch, three French, and one Belgian patient received a new official work disability status, and in two of the Dutch patients the disability level was increased. In the Dutch group two elderly patients retired as did two in the French and one in the Belgian group.
Economic activity at baseline per country for patients with AS completing the study. Results are shown as number (%)
For those with a paid job (NL: n=58, F: n=40, B: n=15), the number of patients reporting AS related sick leave was 30 (52%), 19 (48%), and seven (47%) (χ2, p=0.8). Table 3 presents the mean days of sick leave per working patient and the average duration of one episode of sick leave; both were significantly (bootstrapping) higher in the Dutch than in the French patients. In NL eight (14%) patients had sick leave longer than the friction period (four consecutive months) compared with two (5%) French patients and one (7%) Belgian patient.
Comparison among the three countries of AS related absence from paid work, mean income, and costs due to productivity loss, calculated by the friction cost method for patients with a paid job
To compare employment and work disability in patients with AS with the general population, raw rates were adjusted for age and sex using the population of each country as reference. Adjusted employment (and adjusted part time employment) was 55% (24%) in NL compared with 72% (19%) and 72% (24%) in F and B respectively. Adjusted work disability (and adjusted partial work disability) was 41% (14%), 23% (16%), and 9% (0%) in NL, F, and B, respectively. Different sources showed that national employment figures in 1998 ranged from 65% to 68% for NL, were about 60% in F, and between 54% and 59% in B. National work disability rates ranged from 4.5% to 7% in NL and from 0.3% to about 1.8% in F. For B a figure of 3.9% was found. National unemployment rates at that time were 5.2%, 12.4%, and 9.2% in NL, F, and B, respectively. Mean national sick leave was 11.2, 15.7, and 7.1 days per working person in NL, F, and B.32
For the patients with AS, and after adjusting for baseline differences in patient characteristics, living in F (compared with both other countries) was associated with a higher chance of having a paid job (OR=4.00; 95% CI 1.02 to 15.65). On the other hand, living in NL (compared with both other countries) was a significant contributor to the risk of being work disabled (OR=3.82; 95%CI 1.33 to 11.01) and to the length of sick leave (OR=0.64; 95%CI 0.43 to 0.97). Country did not contribute to a difference in the risk of having an episode of sick leave during the follow up period. Table 4 shows the results of the predictive models in identifying risk factors for (a) having an episode of sick leave during the two years' follow up and (b) the number of days of sick leave. Whereas manual professions and physical function were associated with having an episode of sick leave, the length of sick leave was higher for those living in NL, those having IBD, and those having higher cumulative disease activity.
Result of the multiple regression analyses of occurrence of sick leave, number of days sick leave, and friction costs in those with a paid job
Productivity costs
Table 3 presents for each country the mean FC in euros per patient per year for those with a paid job and table 5 presents the FC and HC costs for all the patients in the study. For the HC costs, not only the total costs but also the costs due to absence at work and the costs due to work disability are given separately. In univariate analysis (bootstrapping) mean FC in those with a paid job and HC costs in all patients were significantly higher in NL than in F and B. Clearly, using the HC approach results in higher productivity costs. After adjusting for several confounders in multivariate analysis, living in NL as opposed to F and B was significantly associated with higher FC (OR=0.63; 95% CI 0.42 to 0.96) and HC costs (OR=0.46; 95% CI 0.32 to 0.68). Table 4 gives the results of the full predictive multivariate model to assess determinants of FC.
Comparison among the three countries of AS related absence from paid work and productivity costs calculated by friction cost method and human capital method for all the 209 patients completing the study
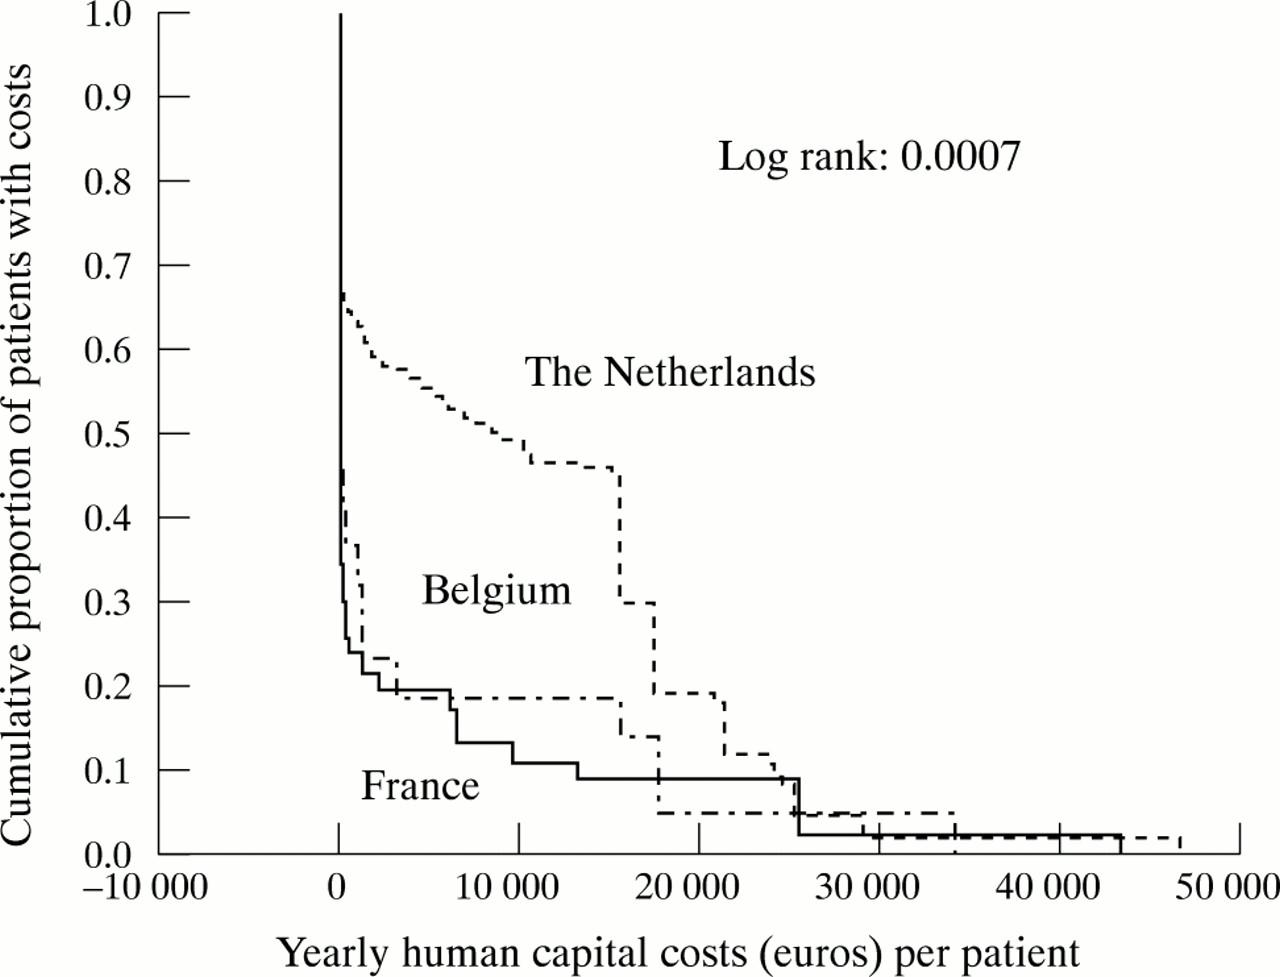
Figures 1 and 2 present the Kaplan-Meier curves with associated log rank probability estimates of the FC (in those with a paid job) and HC costs (in the active population). They illustrate for each level of costs the proportions of patients who incurred these or even higher costs. Figure 1 shows that in all countries approximately 50% of patients generate friction costs. Two thousand euros FC per year or more are incurred by 20% of patients in NL as compared with 7% of patients in F and B. Figure 2 shows that the proportion of patients having HC costs is far higher in NL. In NL, 50% of patients have more than 10 000 euros HC costs per year as compared with 18% of patients in B and 10% in F. The curve for the Dutch patients seems to have two parts, which can be explained by the presence of two separate groups of patients contributing to the HC costs: those with partial work disability and those with full work disability.

Kaplan-Meier curve of patients with AS with a paid job, illustrating the proportion of patients incurring a specific level of friction costs in each country separately.
Kaplan-Meier curve of the active working population, illustrating the proportion of patients with AS incurring a specific level of human capital costs in each country separately.
National costs
If a minimal point prevalence of AS of 0.075% in each country15 and population sizes of 15.5 million for NL, 57.4 million for F and 10.2 million for B is accepted, 24 the number of patients with AS in each country would be 11 250 patients in NL, 43 062 in F, and 7646 in B. If we assume that our cross sectional study sample is representative of the national group of patients with AS, the total yearly friction costs would be 6.3 million euros in the NL, 14.0 million euros in F, and 2.1 million euros in B. The total yearly human capital costs would be euros 103.7 million in NL, 151.2 million in F, and 52.3 million in B. For the FC, this represents 0.0018, 0.0011, and 0.0009% of the gross national product of each country and for the HC costs 0.029, 0.017, and 0.023%.
Sensitivity analysis
Table 6 shows the results of the sensitivity analyses of the reference case (FC for those with a paid job). In a first sensitivity analysis the total days absence at work were used instead of the disease-specific absence. Seventy five per cent of patients from NL, 48% from F, and 73% from B with a paid job reported an episode of sick leave, resulting in 23 (range 0–141), seven (range 0–77), and 15 (range 0–60) days per patient per year in the three countries, respectively. Associated friction costs remained significantly higher in NL as compared with both other countries.
Sensitivity analysis of the friction costs (euros/patient/year) for those with a paid job
In those with a paid job, the proportion of patients with one or more missing questionnaires was 100%, 32%, and 93% and the proportion of missing questionnaires was 15.5%, 4.2%, and 12.2% in NL, F and B, respectively. The method of assigning missing values did not change the differences in costs among countries. However, assuming that each missing questionnaire represents absence at work for that entire two month period would increase costs markedly compared with the reference case.
The numbers of patients with more than six months' sick leave during the two years' follow up was 6/58 (10%), 1/40 (2.5%), and 0 (0%) patients in NL, F, and B, respectively. When the length of sick leave of the outliers was replaced by the mean duration of sick leave of the remaining patients of the same country, the difference between NL and B lost statistical significance, reflecting the sensitivity of the analyses to the length of the period of sick leave. The same observation was made when duration of sick leave of those patients was replaced with more than three months sick leave (11 patients (19%) in NL as opposed to three (7.5%) in F, and one (7%) in B).
Finally, country-specific average production values, first from Eurostat and next from each country's national bureau of statistics were used instead of patient reported production values. Eurostat reported an average income per working day of 88 euros for NL, 82 euros for F, and 96 euros for B. The National Bureau of Statistics of each country reported an average income per working day of 94 euros, 115 euros, and 92 euros in NL, F and B respectively. Again, the difference in FC between NL and B lost significance.
Effect on quality of life
In the whole group QoL, measured by EQ-5D, was worse in those with chronic work disability (OR=1.67; 95% CI 1.2 to 2.3; p<0.002). Despite the higher work disability rate in NL, QoL was better among the patients from NL than among those from F and B (OR=0.37; 95% CI 0.26 to 0.53; p<0.000). However, the absence of interaction between work disability and country makes it unlikely that the effect of work disability on QoL in NL is different from that in both other countries. Therefore the better QoL of Dutch patients cannot be explained by the difference in work disability. QoL in those with a paid job was not influenced by having or not having an episode of sick leave and no interaction between country and having sick leave was observed.
DISCUSSION
In AS disease related work disability, absence from paid work, and productivity costs are substantial. In addition, there are significant differences in these outcomes among the three European countries. Work disability rates as well as days absent from paid work were higher in NL than in F and B. These differences persisted after adjusting for sociodemographic and disease characteristics, suggesting that differences in the organisation of the social security system contribute to this observation. We had expected that the provision by the social security system of partial work disability while continuing a part time job (which is possible in NL and F but not customary in B) might have resulted in better employment in these countries. This was certainly not found in Dutch patients with AS. Possibly, the more favourable disability benefit in NL is an incentive for withdrawal from the labour force. This however, remains a hypothesis because in all countries reinsurance against loss of income is possible and we have no specific data on this issue.
Interestingly, although the mean number of days of sick leave was higher in NL, the proportion of patients having an episode of sick leave over the two year period was similar in the three countries. While manual professions and worse physical function were predictors of incurring sick leave, the length of sick leave was associated with higher cumulative disease activity, the presence of associated IBD, and living in NL. Again, the hypothesis can be proposed that the more favourable benefit in NL is an incentive to prolonging sick leave.
Because we were inclined to attribute the higher work disability rate and increased length sick leave in the NL to the more favourable social security system, we wondered if this explained the better QoL experienced by Dutch patients with AS, despite the higher disease activity and worse physical function in this group. However, in all countries work disability (but not sick leave) was associated with worse QoL and this effect was not different among the countries studied. The better QoL reported by the Dutch system can therefore not be attributed to the differences in work disability and sick leave.
We calculated societal productivity costs by both the FC method and the HC approach. FC in those with a paid job as well as HC costs in the active population were higher in NL than in both other countries. This difference remained after adjusting for sociodemographic and disease characteristics. As expected, HC costs were higher than FC in all countries, but this was more pronounced in NL, reflecting the higher work disability rate. We agree with other health economists that FC provide a better estimate of the true societal costs of productivity loss (indirect costs) and therefore have chosen this method as our reference case.30,31 However, the impact of disease due to work disability is not reflected in monetary terms when using FC in costs-of-illness studies.
In the sensitivity analysis of the FC in those with a paid job, our model proved sensitive to the number of days sick leave. The difference in costs between NL and B lost significance when the duration of sick leave of outliers was replaced by the country-specific group mean. Although this might be because of the small number of patients included in the Belgian group, this observation has potential implications for the precision in collecting data on sick leave and the method of assigning missing data on days of sick leave. In our study, sick leave information was collected by bimonthly questionnaires; a recent study showed that recall is reliable only for a period up to two months.33 However, this was only one observation and there are no data yet on the best way to assign missing values. These issues should be studied more closely. The association between country and FC was also sensitive to the choice of the production value per working day. The difference in FC between NL and B lost significance when country-specific (average) production values were used instead of patient reported production values. Comparing the patient reported income with the national reported mean income, we feel that more Belgian patients must have underreported their income. To our knowledge, there are no (cross cultural) studies validating self report of income.
There is no consensus on the best way to present and test cost data, which are usually highly skewed, even after log transformation. Because bootstrapping has been recommended as the preferable method29 we chose this technique to test the difference in days sick leave and costs univariately. Interestingly, the results were identical when one way ANOVA (with post hoc analysis) was used. Only the difference in FC in those with a paid job between NL and B lost significance, probably as a consequence of the small number of patients in the B group. Furthermore, to adjust for confounders and to analyse determinants of days of sick leave and costs we chose a Cox proportional hazard analysis. In contrast with linear regression analysis, Cox regression can handle skewed data. Moreover, survival statistics allow computation of Kaplan-Meier curves and visualisation of differences in proportions of patients having a specific amount of costs for each country.
We found only one published cost-of-illness study in AS, conducted in France in 1979. Of 172 patients in this retrospective survey, 127 belonged to the active population (aged 16–65 years). Twenty per cent were permanently work disabled and 6.6% temporarily. This resulted in societal productivity costs of 8045 French francs per patient per year.34 The method used in that publication is comparable with the HC approach used in our study. For our French patients belonging to the active population, HC costs were 3595 euros or 23 581 French francs per year, which is almost four times higher than 21 years before. For rheumatoid arthritis (RA) several studies have calculated the indirect costs of disease. Data from the review by Cooper1 and from more recent studies3,4 would give productivity costs for RA (converted to 1996 American dollars, using consumer price index) of $1467 to $37 501 (1254 euros to 32 052 euros using 1998 euro currency) per patient per year. Studies are not directly comparable owing to differences in the patient populations studied, differences in the methods of collecting data, and the method chosen to calculate the productivity costs. Most studies adapted the HC approach, and the results of HC costs in our patients with AS fall within the limits of these studies.
Our study certainly has limitations. Firstly, the number of patients included is small, especially in the Belgian group, which might be responsible for a non-detected difference in economic outcomes between F and B. Secondly, the patient sample was from hospital patients and they may have more severe disease, resulting in a worse impact on work status.35 Also, in NL all patients from the register were recruited, whereas in F and B consecutive outpatients were included. The latter method might lead to inclusion of patients with more severe disease, but baseline characteristics do not support this. Moreover, patients with more severe disease would have had higher and not lower costs. Thirdly, information on work status, days of sick leave, and income was collected through bimonthly questionnaires and not ascertained by other sources. Fourthly, while we can interpret the multivariate models on days of sick leave and FC in this prospective study as predictive models, the same cannot be done for work disability and (associated) HC costs because the vast majority of work disabled patients had been granted this status before entering the cohort.
There were specific difficulties when comparing data between the different countries. Firstly, there are few epidemiological reports which can be used to find out if cross sectional differences in sociodemographic characteristics and disease characteristics reflect true differences or are a possible consequence of sampling. Secondly, it is difficult to find reference data on educational level, professional class, income, work disability, or sick leave from the national populations in a comparable format, and these data are certainly not up dated yearly. This is important because our figures on work disability and sick leave in AS might partly reflect national differences in work disability and sick leave among the countries studied. In NL work disability and sick leave were higher in AS but also in the general population. However, because population data on sick leave and work disability by age and sex categories were not available for all countries owing to the above mentioned problems, we could not calculate the precise risk difference for patients compared with controls within each country. Also, our results show that the choice of the mean national production value from different (and slightly conflicting) sources alters the productivity costs. Case-control studies would be a solution for some of these problems but are not always feasible. Although some authors studied the effect of country36 or health insurance systems37 on use of health resources in the rheumatic diseases, the influence of country or social security system on work disability and productivity costs has not received much attention. A comparison of the total indirect costs (HC approach) of diseases between NL, Sweden, and America confirms important differences between countries. It was shown that the share of indirect costs to the gross domestic product was 19% in NL (in 1988), 14% in Sweden (in 1983), and 8% in the USA (in 1980).38 Zink reports that in RA as well as in AS, the work disability rates in Eastern and Western Germany before reunification differed significantly. It is considered that differences in the economic prosperity (reflected in unemployment) in both countries is the most likely explanation for the observed difference.39 In addition, we think that differences in organisation of the social security system may provide different incentives or disincentives to leave or stay in the labour force.
CONCLUSION
The impact of AS on labour force participation and productivity costs is influenced not only by sociodemographic and disease characteristics but also by country (or states), reflecting differences in the social security system or economic prosperity, or both. This has important implications for generalisability of health economic analysis across countries.
Acknowledgments
We thank Willy Peeters for providing information on the Belgian healthcare system, Maryse Meziere for providing additional information on the French patients, Esther Huibers and Erik de Klerk for developing the database.