Article Text

Abstract
OBJECTIVE To quantifyN-acetylaspartate (NAA), total creatines (tCr), total cholines (tCho), and myo-inositol (mI) levels in normal and abnormal appearing white matter of patients with neuropsychiatric systemic lupus erythematosus (NPSLE) in order to determine the specific changes in metabolite concentrations.
METHODS Axial proton density and T2 weighted magnetic resonance images, and short echo time (TE 30 ms) 1H spectra were acquired with a GE SIGNA 1.5 T magnetic resonance system. Concentrations of NAA, tCr, tCho, and mI were determined, using brain tissue water as a reference, from nine patients (seven female, mean age 40.3 years, range 16–65) with NPSLE and eight healthy women (mean age 43 years, range 31–65).
RESULTS A significant rise of tCho (12.4%, p<0.05) and mI (31.4%, p<0.005) and a significant reduction in NAA (−12%, p<0.05) was found in normal appearing white matter compared with controls. Analysis according to severity of the clinical NPSLE features (subgrouped as major or minor) showed that SLE major had reduced NAA compared with SLE minor (−18.4%, p<0.05) and controls (−20%, p<0.005). The SLE major group showed a significant rise of mI (32%, p<0.01) and the SLE minor group a significant increase in tCho (18.6%, p<0.05) compared with controls. Longitudinal analysis of brain metabolites in normal appearing white matter showed consistent abnormalities in NAA, tCho, and mI in a patient with stable clinical features and a constant rise of tCho, but transient rise of mI was seen during a flare of disease in another patient.
CONCLUSION Quantitative1H magnetic resonance spectroscopy (MRS) suggests a particular course of neurometabolite changes that precedes irreversible reductions in NAA and permanent neuronal loss. Initially, in patients with SLE minor, there is a significant rise in tCho and a trend (reversible) for mI also to be raised. In patients with SLE major the NAA is significantly and permanently reduced and mI is significantly raised, whereas the tCho levels are near normal. Further investigations are needed to determine how specific MRS is as a clinical marker for brain disturbance in SLE.
- magnetic resonance spectroscopy
- neuronal damage
- systemic lupus erythematosus
Statistics from Altmetric.com
Systemic lupus erythematosus (SLE) is an autoimmune rheumatic disease typified by clinical features associated with autoimmune phenomena.1 Neuropsychiatric (NP) symptoms are probably one of the more common features and are the least understood. Neuropsychiatric systemic lupus erythematosus (NPSLE) has probably caused significant morbidity for many years,2 but we are only beginning to understand its pathophysiology.
The clinical manifestations of NPSLE, both neurological and psychiatric, may be obvious—for example, psychosis, stroke, and epilepsy, or there may be more subtle symptoms, such as headache and neurocognitive dysfunction.3 The pathological features mirror the spectrum of clinical manifestations4 and may be either an inflammatory (for example, vasculitic) or a non-inflammatory (for example, thrombotic) vasculopathy.5
Clinical investigations to help make a diagnosis of NPSLE include immune system changes indicating increased lupus activity, as shown by an increase in serum and cerebrospinal fluid antibodies, together with changes in C3 complement levels.6 The electroencephelogram may demonstrate diffuse or focal patterns of abnormality and, although helpful in defining NPSLE in patients with affective disorders, is not sensitive enough for diagnosis.5 Neuropsychological assessment may also show diagnostically useful abnormalities.7
Technetium brain scans, computed tomography (CT) scanning, angiography, positron emission tomography, and single photon emission CT have not succeeded in visualising the subtle pathological features of NPSLE.8 In contrast, magnetic resonance imaging (MRI) can visualise diffuse and focal changes, which may help in diagnosis9 and can identify patients more likely to respond to immunosuppressive treatment.10
MRI changes however can be fairly widespread in patients with SLE and need not necessarily be associated with NP symptoms.11 It has been suggested that these abnormalities may have a similar prevalence in the general population, and in patients with SLE who do not have a history of NP manifestations.12 ,13Additionally, there seems to be no correlation between MRI changes and the presence of the lupus anticoagulant14—an antibody with a pathophysiological role in NPSLE.
More recently, magnetic resonance spectroscopy (MRS) has shown cerebral biochemical changes in NPSLE.15 Specifically, theN-acetylaspartate (NAA)/creatine (Cr) ratio is significantly reduced in normal and abnormal appearing white and grey matter in some patients with NPSLE.16 Measurements of metabolite ratios, though technically easier, are less satisfactory than measurement of absolute concentrations as, clearly, one cannot be sure which member of a ratio is changing. Knowledge of the specific metabolite changes, rather than ratios, may provide more insight into the underlying pathophysiology of disease. Hence in this study we attempted a quantitative assessment of NAA, total creatine (tCr), total choline (tCho) and myo-inositol (mI) levels in normal and abnormal appearing white matter of patients with SLE with clinical symptoms suggestive of NPSLE.
Methods
MAGNETIC RESONANCE IMAGING AND SPECTROSCOPY
Axial proton density and T2 weighted MR images were acquired for radiological assessment using the fast spin echo technique on a GE SIGNA 1.5 T MR system. Imaging parameters were repetition time (TR) = 3500 ms, TEeffective = 19 and 95 ms with a 12 echo train length, 256 matrix over a 22 × 16 cm field of view and 5 mm contiguous slices. 1H spectra were acquired with PROBE (Proton Brain Exam), the manufacturers' automated MRS protocol,17 using STEAM localisation (TE 30 ms, TR 2020 ms). Metabolite spectra suppressed by water were obtained with 256 averages and the water signal with 32 averages within each PROBE acquisition. Voxels (2 × 2 × 2 cm3) were selected from normal appearing parietal white matter in all patients. In four patients smaller voxels were selected to include white matter lesions identified by MR imaging.
MRI ANALYSIS
The MR images were analysed independently by one of us (CH) and graded as follows: 0 = no abnormality detected, 1 = increased signal intensity in one location, 2 = increased signal intensity in two or more locations, 3 = increased signal intensity plus other change (for example, cerebral oedema, or isolated cerebral infarct).
MRS ANALYSIS
Metabolite concentrations were calculated with the brain tissue water signal as a reference using methods and analysis protocols similar to that described previously.18-22 Peak areas of NAA, tCr, tCho, mI, and the water reference signal were determined with VARPRO time domain analysis20 ,23 using the MRUI analysis software (see “Acknowledgments”). The metabolite signal was corrected for line shape distortions and zero order phase by using the phase term of the unsuppressed water signal.24 The amplitude of the unsuppressed water signal was fitted automatically using Hankel Lanczos singular valve decomposition,25 which was also used to remove the residual water signal from the water suppressed metabolite spectra.20 To prevent overestimation of metabolite peak areas owing to the broad baseline signal a Gaussian line shape function was used and the first point of the free induction decay was excluded from the fitting procedure. It was assumed that magnetic field inhomogeneities dominate the metabolite peak line width, because T2 variations between metabolites are expected to be small, and the four peaks of interest were fitted with identical fixed line widths.26 ,27 To determine the metabolite line width an initial fit was made to just the NAA, tCr, and tCho peaks using equal line widths. The mI peak was initially excluded from the fit to prevent the average peak line width being overestimated owing to the partial overlap of mI with glutamate/glutamine peaks. A second fit was then performed to all four peaks, but with the metabolite line widths now fixed to that obtained from the initial fit. Metabolite concentrations were calculated using the unsuppressed tissue water signal as a reference (41.7 mol/l) and no corrections for T1 or T2 relaxation were made (see “Discussion”).
PATIENTS AND HEALTHY CONTROLS
Nine patients (seven female, mean age 40.3 years, range 16–65) were studied. All the patients satisfied the American College of Rheumatology criteria for the classification of SLE28 and had a variety of clinical and immunopathological features. The only common clinical feature was the presence of NPSLE, and this was classified as major (five examinations) if there were significant neurological features, such as stroke or seizures, encephalopathy, dementia, or bitemporal quadrantonopia, and minor (four examinations) if there were features such as headache and cognitive dysfunction. Two patients, Nos 6 and 7, were studied over a period of 23 months (five examinations) and 31 months (six examinations) respectively.1H spectra were also obtained from the parietal white matter of eight women, mean age 43 years (range 31–65), as control data. Healthy subjects had no history of psychiatric illness or autoimmune disease.
Results
BRAIN METABOLITE ANALYSIS
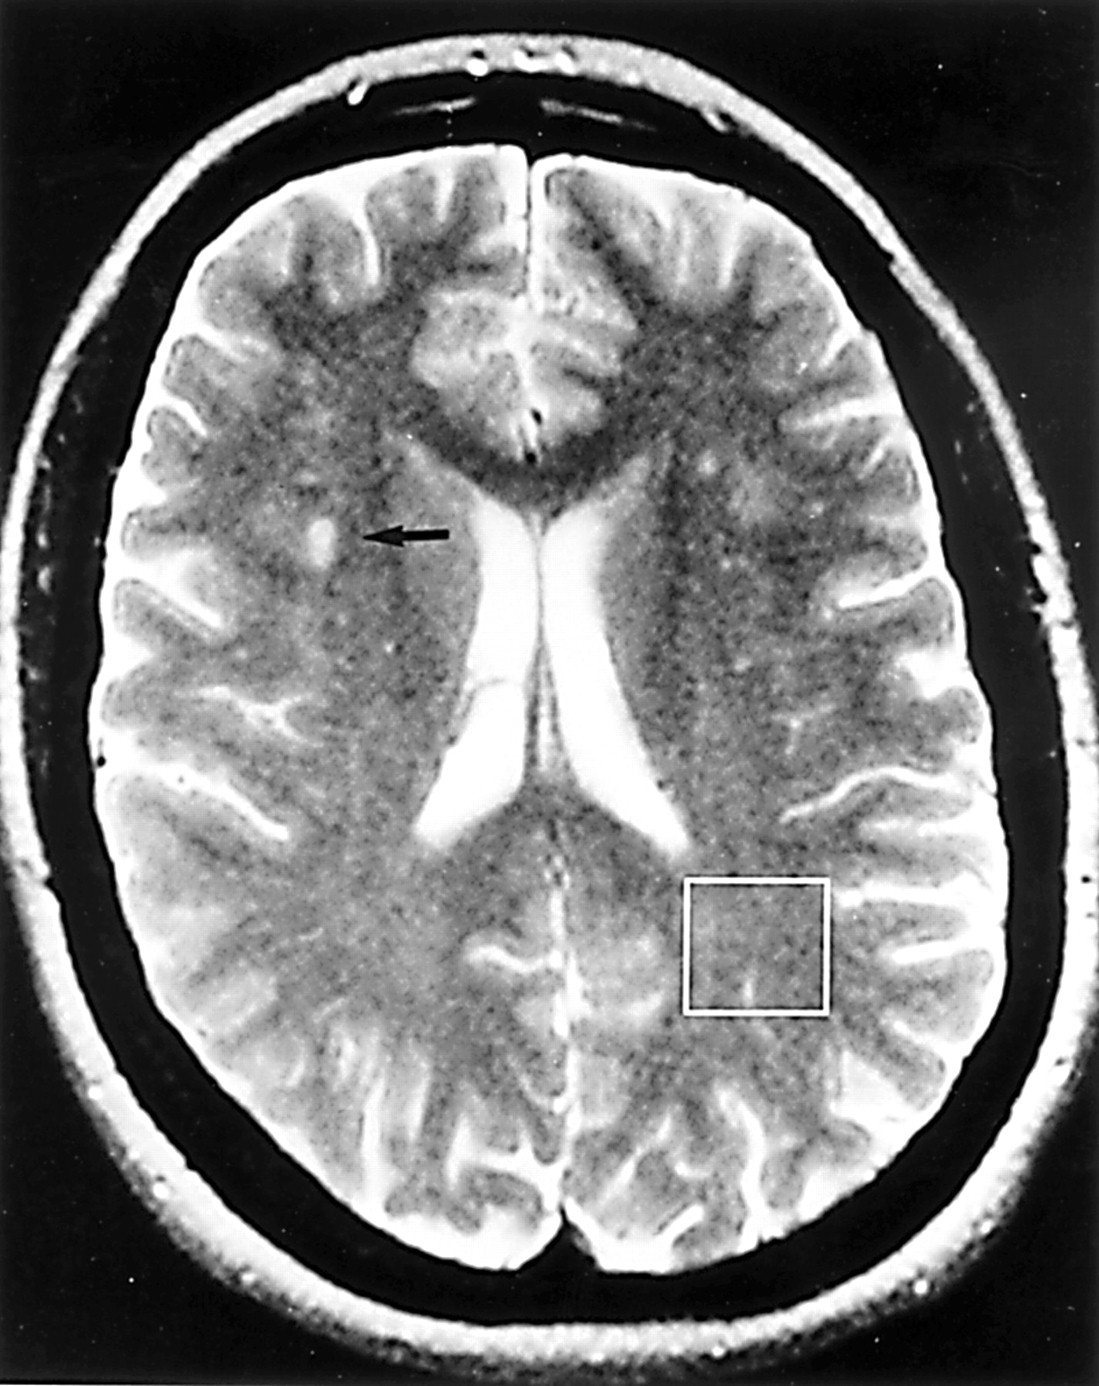
Figure 1 shows the voxel position for spectroscopy of normal appearing white matter on a T2 weighted image of a patient with SLE. Figure 2 shows the spectrum from this patient demonstrating mI and tCho raised by more than 2SDs above the normal mean during a flare of the symptoms of SLE.

T2 weighted image showing several small foci of increased signal intensity in the white matter of both cerebral hemispheres. The largest of these is indicated by an arrow. The box represents a voxel from which 1H spectra were obtained.

Magnetic resonance spectra from patient 6 at months 1 (A) and 18 (B) showing raised levels of tCho and mI at month 18 in comparison with month 1. (Note: the spectral changes observed above 4 ppm are not significant because this region of the spectrum is distorted by the techniques of water suppression and removal of residual water during data processing.)
Absolute metabolite concentrations
Table 1A gives the mean metabolite concentration data from all patients and normal subjects. The variation in metabolite line width for the patients with SLE was small (average 2.6 (0.4) Hz) and correlated (p<0.001) with the water line width as would be expected because both are mainly determined by the field homogeneity. There was no correlation (p>0.2) between peak line width and concentration change for any metabolite for the NPSLE group as a whole, or for the two longitudinal studies, indicating that the concentration changes are not artefactual. Our normal data (table 1) also show good reproducibility with low standard deviations, as others have shown using the automated PROBE spectroscopy technique.21 ,29From the average data for all the patients studied with NPSLE we observed a significant rise of tCho (12.4%) and mI (31.4%) and a significant reduction in NAA (–12%). For the four lesions studied in patients with SLE only NAA (–51.5%) mean metabolite levels were significantly reduced compared with normal appearing white matter. However, there was a large range of metabolite levels in lesions (for example, one patient had no measurable lesion NAA or mI), weakening statistical comparisons of the average of this small dataset.
Tables 1A and B Brain metabolite concentrations (mmol/l) and concentration ratios in patients with systemic lupus erythematosus (SLE) and normal subjects.
Metabolite ratio data
For metabolite ratios in normal appearing white matter of patients with SLE, mI/tCr was significantly raised and both NAA/tCho and NAA/mI were significantly reduced, compared with the normal study group (table 1B).
Clinical relations
After dividing the patients into SLE major and SLE minor, we found a significant reduction only in NAA concentration for SLE major and a significant increase in tCho for SLE minor, but mI was raised for both patient groups (table 1A). Figure 3 compares NAA and mI levels for these two groups of patients with SLE with normal subjects. For 7/9 of all the patients with NPSLE, mI was raised above normal mean levels, whereas it was mainly the patients with SLE major who had a reduction in NAA. No relation between MRI, MRS, clinical findings, and immunopathological changes were found.

Relation between N-acetylaspartate (NAA) and myo-inositol (mI) levels in patients with major and minor features of neuropsychiatric systemic lupus erythematosus and normal subjects.
LONGITUDINAL ANALYSIS OF BRAIN METABOLITES IN NORMAL APPEARING WHITE MATTER
Patient 6
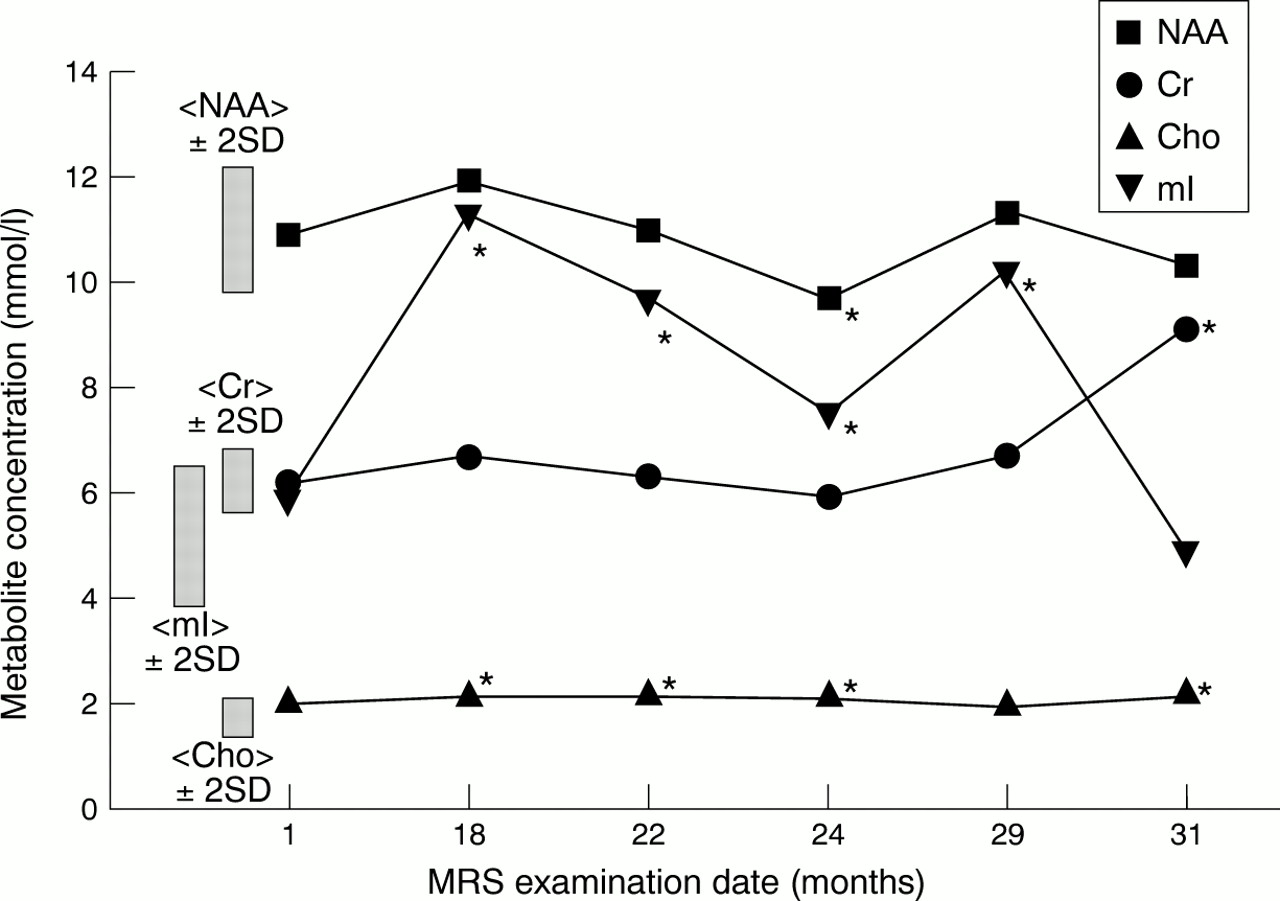
The clinical condition of the patient was characterised by a flare of disease. Over the period of investigation there was a significant increase (more than 2SDs above normal) in tCho and mI concentrations (fig 2). However, there were large fluctuations in mI, with the mI levels being normal at months 1 and 31 but raised more than 2SDs above normal in the intervening months (fig 3). Additionally, at month 24 significant abnormalities in NAA as well as mI and tCho were found (fig4). Between months 6 and 27 the patient developed a flare of disease characterised by increasing immunopathology (for example, reduced complement C3/C4, raised anti-double stranded DNA antibodies), skin and buccal mucosa vasculitis, together with mild lupus nephritis.

Longitudinal analysis of brain metabolites from patient No 6. This patient developed a flare of disease between months 6 and 27. During this time myo-inositol (mI) levels became significantly abnormal and reduced to baseline after treatment with a course of intravenous immunoglobulin. NAA = N-acetylaspartate; Cr = creatines; Cho = cholines.
Neuropsychiatric features consisted of headaches, poor concentration, and memory loss. Between months 6 and 27 the patient was treated with a variety of immunosuppressive drugs (azathioprine, corticosteroid, hydroxychloroquine, and mepacrine). Disease flare was finally brought under control with a course of intravenous immunoglobulin.
Patient 7
The clinical condition was constant throughout the investigation. This patient had clinical features of SLE consisting of general malaise and arthralgia, together with minor neuropsychiatric features comprising headaches, poor concentration, and memory loss. The levels of metabolites were also constant, but with abnormalities in NAA and mI (data point 7 in fig 3) as well as in tCho.
Discussion
Previous 1H MRS studies of SLE have used metabolite ratios and reported reductions in NAA/tCr15 ,16 ,30-33and NAA/tCho,31 ,33 and increased tCho/tCr.31-33 Our data (tables 1A and B) are consistent with the metabolite ratio data of these previous studies, but by using quantitative 1H MRS (table 1A) we have now shown that the absolute metabolite concentration changes are: NAA is reduced, tCho is increased, whereas the tCr concentration is unchanged. Previously, these absolute concentration changes had just been inferred from metabolite ratio data. We also make the new observation of an increase in mI concentration in normal appearing white matter of patients with NPSLE. In lesions we found a reduction in both NAA and tCr concentrations. Although this results in reduced NAA/tCr ratios as others have observed,34 ,35 we comment that because in lesions both NAA and tCr are reduced, their ratio is a less reliable indicator of pathological changes than are absolute concentration changes. In contrast with this, we found that the average concentrations of NAA and tCho of normal appearing white matter in NPSLE both deviate from normal but in opposite directions. Hence the NAA/tCho ratio in normal appearing white matter can be a sensitive indicator of pathological change, as shown in a recent study in which NAA/tCho was highly correlated with neurocognitive dysfunction.32
In calculating the metabolite concentrations we have not corrected our calculated concentrations for the effects of T1 and T2 relaxation. When published values of T1 and T2 relaxation times in normal white matter are used,18 ,19 for the TE and TR in this study, the correction factors for water and metabolite relaxation are almost equal (0.65 for water and between 0.65 and 0.7 for the metabolites) and so cancel out. Our calculated metabolite concentrations in normal white matter, without explicit relaxation time correction, are therefore equivalent to absolute concentrations, and within the errors of relaxation time measurements, are in agreement with quantitative data from several other studies.18-20 ,22 ,28 For the patient data, excepting the lesions, we selected regions of normal appearing white matter. One study has shown that in NPSLE there are only very small changes in the T2 relaxation of tissue water in white matter.36 Therefore we do not expect water relaxation time changes that would significantly affect our measurement. Furthermore, for the TE and TR used in this study, typically a change of 50% in water or metabolite relaxation times would be needed to produce a 10% change in measurement,19 ,27 and changes of this magnitude would only be expected for complete infarction.27
The metabolite changes seen are probably not specific to NPSLE but represent neurometabolic impairment produced by systemic injury.33 NAA is a neuronal marker and thus its reduction is a non-specific indicator of neuronal damage in several diseases—for example, stroke,27 dementia,37 and multiple sclerosis.38 In NPSLE the reduction in NAA in normal appearing white matter is believed to be a result of neuronal injury caused by microinfarcts from extensive small vessel damage.31 Raised tCho has been ascribed to inflammatory processes33 ,39 rather than to demyelination or cell membrane degradation as in stroke27 and multiple sclerosis lesions.38 This would also be consistent with the lack of abnormally high lipid signals, which are found in some diseases when tCho is raised,27 ,38 but not in our short echo time1H MRS studies of SLE and those of others.31 ,34 Raised mI, which is believed to have a role as an osmoregulator,40 ,41 may also be the result of inflammation and hence a disturbance in cerebral osmolytes. Although a signal from glycine may also be present at the same resonance position as mI, its concentration is an order of magnitude lower than mI and so is unlikely to be a major contributor to any spectral changes.42 Both mI and tCho have been found to be raised in hypernatraemia43 and diabetes,44 and reduced in hyponatraemia.41 Abnormalities in mI levels, when NAA was normal, have also been reversed with appropriate treatments.40 ,41 In one patient with SLE minor (figs 1,2, and 4 and patient No 6 in fig 3) we also observed a reversible rise of mI after treatment, with NAA remaining normal over this period. Raised mI has preceded NAA reduction in both AIDS, dementia,45 and Down's syndrome,46suggesting that these metabolic changes may precede irreversible neuronal damage. Hence it is possible that raised mI, but normal NAA, in SLE minor may also be due to cell metabolism changes as a result of vasculitis and inflammatory sequelae, which may be reversible if treated early enough. In contrast with the patients with SLE minor, our patients with SLE major had both increased mI and decreased NAA (fig3). As mI is found predominantly in glial cells, raised mI and reduced NAA in patients with SLE major may reflect gliosis as the aftermath of neuronal loss, as suggested from studies of dementia.45 ,46
Although this is a limited dataset, our quantitative data suggest that the raised mI and tCho concentrations seen in SLE minor may be the result of inflammation that precedes irreversible reductions in NAA and therefore permanent neuronal loss. Further observations in larger patient groups are now needed to relate mI to clinical condition and treatment to confirm this hypothesis.
Acknowledgments
The Magnetic Resonance User Interface (MRUI) software (version 97.1), used for time domain analysis of the 1H spectra, was obtained (free to academic researchers) fromhttp://www.mrui.uab.es/mrui/mruiHomePage.html.
References
Footnotes
FA Howe and JR Griffiths acknowledge the financial support of the Cancer Research Campaign (CRC, grant No SP1971/0402), UK.