Article Text

Abstract
Objective: The performance characteristics of hyaline articular cartilage measurement on magnetic resonance imaging (MRI) need to be accurately delineated before widespread application of this technology. Our objective was to assess the rate of natural disease progression of cartilage morphometry measures from baseline to 1 year in knees with osteoarthritis (OA) from a subset of participants from the Osteoarthritis Initiative (OAI).
Methods: Subjects included for this exploratory analysis are a subset of the approximately 4700 participants in the OAI Study. Bilateral radiographs and 3T MRI (Siemans Trio) of the knees and clinical data were obtained at baseline and annually in all participants. 160 subjects from the OAI Progression subcohort all of whom had both frequent symptoms and, in the same knee, radiographic OA based on a screening reading done at the OAI clinics were eligible for this exploratory analysis. One knee from each subject was selected for analysis. 150 participants were included. Using sagittal 3D DESSwe (double echo, steady-state sequence with water excitation) MR images from the baseline and 12 follow-up month visit, a segmentation algorithm was applied to the cartilage plates of the index knee to compute the cartilage volume, normalised cartilage volume (volume normalised to bone surface interface area), and percentage denuded area (total cartilage bone interface area denuded of cartilage).
Results: Summary statistics of the changes (absolute and percentage) from baseline at 1 year and the standardised response mean (SRM), ie, mean change divided by the SD change were calculated. On average the subjects were 60.9 years of age and obese, with a mean body mass index of 30.3 kg/m2. The SRMs for cartilage volume of various locations are: central medial tibia −0.096; central medial femur −0.394; and patella −0.198. The SRMs for normalised cartilage volume of the various locations are central medial tibia −0.044, central medial femur −0.338 and patella −0.193. The majority of participants had a denuded area at baseline in the central medial femur (62%) and central medial tibia (60%). In general, the SRMs were small.
Conclusions : These descriptive results of cartilage morphometry and its change at the 1-year time point from the first substantive MRI data release from the OAI Progression subcohort indicate that the annualised rates of change are small with the central medial femur showing the greatest consistent change.
Statistics from Altmetric.com
Osteoarthritis (OA) is a significant public health challenge, being ranked as the leading cause of disability in elderly people.1 OA affects an estimated 21 million Americans.2 Recent estimates suggest that symptomatic knee OA occurs in 6% of adults 30 years of age or older,3 and in 13% of people age 60 and over.4
Despite being extraordinarily prevalent OA remains a condition that is poorly understood, and a condition for which available effective therapeutic options are limited to symptomatic treatment. The development of therapies aimed at joint preservation in OA is constrained by the slow progress of the condition, its heterogeneous clinical manifestations and the need for long-term follow-up to observe changes in structure.
New technologies may improve the assessment of early disease development, and progression, and could greatly facilitate measurement of structural outcomes in OA clinical trials. Foremost among these is magnetic resonance imaging (MRI), a sensitive non-invasive method for assessing joint morphology.5 6 MRI is ideally suited for imaging arthritic joints as: (1) it is free of ionising radiation; (2) it defines both calcified as well as soft tissue joint components; and (3) its tomographic viewing perspective obviates morphological distortion, magnification and superimposition. MRI of the knee can directly visualise hyaline articular cartilage and cover the whole joint in one examination, meaning that the cartilage defects in the joint can be visualised directly regardless of their location.5
Although yet to be formally accepted by regulatory authorities, many experts now agree that MRI may be the best imaging technique for monitoring the progression of OA of the knee.5 Unfortunately, while MRI has demonstrated great promise, its value in defining disease and as a tool to both monitor disease progression in clinical trials and understand the basis of joint symptoms is not clear.
Methods of analysing MR images of joints are in their infancy. Depending on the segmentation approach and the software used, many different morphometric parameters can be measured or derived, including, among others, cartilage volume in pre-defined regions of the knee, thickness, denuded area, and cartilage volume normalised to bone surface area.
There is a significant body of supporting data on the longitudinal change in cartilage volume as a responsive primary endpoint to reflect OA progression.5 7–9 It is claimed that MRI offers a more sensitive measure of OA and its progression than x-ray. However, based on recent analyses the short-term responsiveness of MRI-derived parameters may not be as good as we had hoped.10 The change of cartilage volume in previous longitudinal studies has varied dramatically but typically shown about 5% loss of knee cartilage volume per year (range of about −1 to −8%) in knees with OA.5 These studies were largely done at 1.5T and there may be performance advantages at 3T given a higher signal and contrast to noise11 and a higher test–retest precision of cartilage measures than 1.5T MRI.12 The performance characteristics of hyaline articular cartilage measurement on MRI need to be accurately delineated to ensure that widespread application of this technology in clinical trials is warranted and scientifically valid. Advances in the use of MRI for clinical trials of OA depend upon continued investigation of the measurement of each feature in the joint that is imaged, and assessment of the metric properties of these measures.
The objective of this exploratory analysis is to assess the rate of natural disease progression of cartilage morphometry measures from baseline to 1 year in knees with OA from a subset of participants from the OAI Progression subcohort.
MATERIALS AND METHODS
Study sample
Subjects included for this exploratory analysis are a subset of the 4796 participants participating in the OAI Study, which is an ongoing 4-year, multi-centre, longitudinal, prospective observational cohort study, focusing primarily on knee OA. The study protocol, amendments, and informed consent documentation were reviewed and approved by the local institutional review boards. Data used in the preparation of this article were obtained from the Osteoarthritis Initiative (OAI) database, which is available for public access at http://www.oai.ucsf.edu/. The specific data sets used are clinical data set 0.1.1 and Image Release 0.B.1 and 1.B.1.
As the study is observational in nature, no blinding procedure is required and no specific hypothesis is predefined.
OAI consists of two subcohorts: progression subcohort and an incidence subcohort. Two different populations of subjects were recruited; 1389 patients with radiographic signs and symptoms of knee OA at baseline were recruited into the progression subcohort and another group at risk for symptomatic knee OA was recruited to the incidence subcohort. All of the participants for the present study are drawn from the progression subcohort.
The inclusion criteria for the progression subcohort of the OAI required that both of the following criteria must be present together in at least one knee at baseline:
Frequent knee symptoms, defined as pain, aching or stiffness on most days of a month during the past year, AND
Radiographic evidence of OA defined as definite tibiofemoral osteophytes (OARSI atlas grade ⩾1) on x-ray. Subjects with severe narrowing (OARSI grade 3 narrowing or bone on bone) in both knees were planned to be excluded. The grading of osteophytes and joint space narrowing was done at each individual OAI enrolment centre.
A total of 160 subjects from the OAI progression subcohort were included in this exploratory analysis. These were selected by OAI from participants who had complete baseline and 1 year MRI data in early 2006, with blocking for sex and centre. This is a convenience sample of subjects.
Radiographic assessment
The bilateral posteroanterior views were obtained using a SynaFlexer frame (Synarc, Inc., San Francisco, California, USA) to position the subject’s feet reproducibly. Body weight is distributed equally between the two legs and the knees and thighs are pressed directly against the wall of the frame, the anterior wall of which was in contact with the Bucky or reclining tabletop of the radiographic unit. This positioning results in a fixed angle of knee flexion of about 20°. A V-shaped angulation support on the base of the frame is used to fix the foot below the index knee in 10° external rotation. The x-ray beam is angled 10° caudal.13
Baseline and follow-up radiographs of the sample of 160 subjects were read independently by two study readers, one a bone and joint radiologist, and the other a rheumatologist (DH). Knee x-rays were read in a paired fashion, blinded to sequence. Readers evaluated the Kellgren and Lawrence (K&L) grade on a 0–4 scale14 as well as individual radiographic features, ie, osteophytes and joint space narrowing on a 0–3 scale of each knee at both time points using the OARSI atlas.15 For the K&L grade we used adjudicated readings that were arrived at by a consensus of the readers. Disagreements on joint space narrowing were also adjudicated if the two readers disagreed.
DH also assessed the anatomical axis and minimum joint space width at the time of these readings. Digital imaging software (eFilm Workstation (Version 2.0.0) software) was used to compose reference lines and calculate these measures. The anatomical axis was defined as the angle formed by the intersection of two lines originating from points bisecting the femur and tibia and converging at the centre of the tibial spine tips consistent with the methods described by Kraus et al where varus is negative.16 The origin of these lines was 10 cm from the knee joint surfaces when included in the field of view on the radiograph.
Selection of knee for analysis
Bilateral MRIs from 160 participants were provided by OAI but only one knee from 150 patients (one knee per subject) was identified for analysis. The rationale for the reducing the sample from 160 to 150 was that the budget for processing the images was limited and in addition we wanted to optimise the use of subjects more likely to progress. The selection of the index knee for this analysis was based on the presence of both symptoms (frequent knee pain) and radiographic evidence of OA in the same knee (see appendix for further details—see web only file).
Magnetic resonance imaging sequence parameters
Images were acquired on a 3T MRI scanner (Siemens Magnetom Trio, Erlangen, Germany) and a quadrature transmit-receive knee coil (USA Instruments, Aurora, Ohio, USA). For the purposes of cartilage segmentation we used the sagittal 3D DESSwe (double echo, steady-state sequence with water excitation) images with a slice thickness of 0.7 mm, 16.3 ms repetition time, 4.7 ms time to echo, 25° flip angle, 160 slices, 140 mm field of view; 384×307 matrix; in-plane resolution 0.37 mm×0.46 mm (interpolated to an isotropic in-plane resolution of 0.37 mm×0.37 mm), 185 Hz/pixel bandwidth, 0% phase oversampling, 10% slice oversampling, 80% phase resolution, 100% slice resolution, 1 average, elliptical filter on, asymmetric echo off, anterior/posterior phase encoding, fast gradient and fast radiofrequency options (acquisition time 10 min 23 s).
Magnetic resonance imaging postprocessing
The analysis of the DESS sequences was done using a semi-automated segmentations algorithm described in detail in the appendix. Image pairs were blinded to time point (baseline or 1 year).
After image segmentation, the following measures were analysed:
Cartilage volume
Normalised cartilage volume (volume normalised to bone surface interface area). The bone surface interface area is the area of the cartilage in contact with bone. The normalisation was done by dividing the measured cartilage volume by the area of measured cartilage in contact with bone plus the area of full-thickness defects (denuded area of bone).
Denuded area (total cartilage bone interface area denuded of cartilage). The denuded area is the area of bone where a full-thickness cartilage defect is present.
Statistical analysis
The objective of this analysis was to assess, in subjects with knee OA, the rate of natural progression of the disease as measured by the change or percentage change from baseline to 1 year in the regular (non-normalised) cartilage volume, normalised cartilage volume and denuded surface area within regions of the knee. Owing to patients being observed at variable follow-up times at 1 year, changes from baseline were annualised assuming a linear trend over time. Image pairs were randomised in a 1:1 ratio using a block randomisation scheme to two different paired analysis scenarios: baseline supervised segmentation follow by tracked segmentation of the 1-year follow-up (denoted by work-flow A) or 1-year supervised segmentation followed by a tracked segmentation of the baseline MRI (denoted by work-flow B). Owing to the bias associated with supervised versus tracked segmentation, subjects from work-flow A group have thickness and volume annual decreases underestimated by bias bi and subjects from work-flow B have annual decreases overestimated by bias bi, where i denotes MRI parameter i.
To estimate the bias associated with work flow, a statistical model for the annual change was developed with work flow as a factor. For each affected endpoint, the magnitude of bias, bi, was estimated and used to obtain corrected (unbiased) measurements of change from baseline. These corrections were applied to each patient, and they rely on the reasonable assumption that the randomisation was effective.
From the bias-corrected data set, summary statistics of the changes (absolute and percentage) from baseline at 1 year and the standardised response mean (SRM), ie, mean change divided by the SD change were calculated. The denuded area parameters were not normally distributed with a large number of values at both baseline and year 1 equal to zero.
A trimming algorithm that removes cartilage tissue outside of a 1 mm thick boundary region was used to reduce the variability in the definition of cartilage tissue. This strategy was generally successful because the variability of most cartilage measures was reduced after trimming (data not shown). The trimmed results are presented for each cartilage morphometry biomarker. The baseline values, annualised mean change and annualised percentage change are each displayed. We also present the changes for two subpopulations of patients. Patients with intermediate OA (K&L grade 2 or 3) and those with definitive OA and varus alignment were separately analysed as these populations may be more likely to experience progression. The definition of varus alignment was defined as subjects with anatomic axis more varus than −2°. There was an extreme positive outlier in change of patella cartilage volume, which made the variance of change large, which has been removed for the patella assessments.
All statistics were computed using SAS 9.0. In accordance with the data user agreement of the OAI the patient level quantitative morphology results in this analysis will be made available through the OAI website.
RESULTS
The demographic characteristics of the study sample are displayed in table 1. On average the subjects were 60.9 years of age and obese with a mean body mass index of 30.3 kg/m2. Approximately half (51%) of the study sample were female, as designed in the OAI protocol. Sixteen per cent of the study sample did not have radiographic OA using the commonly accepted criteria of K&L grade ⩾2. This circumstance arose because eligibility into the OAI progression subcohort was based on the identification of a definite tibiofemoral osteophyte by the individual OAI enrolment centre and some disagreement in radiographic assessment with the adjudicated scoring is expected.
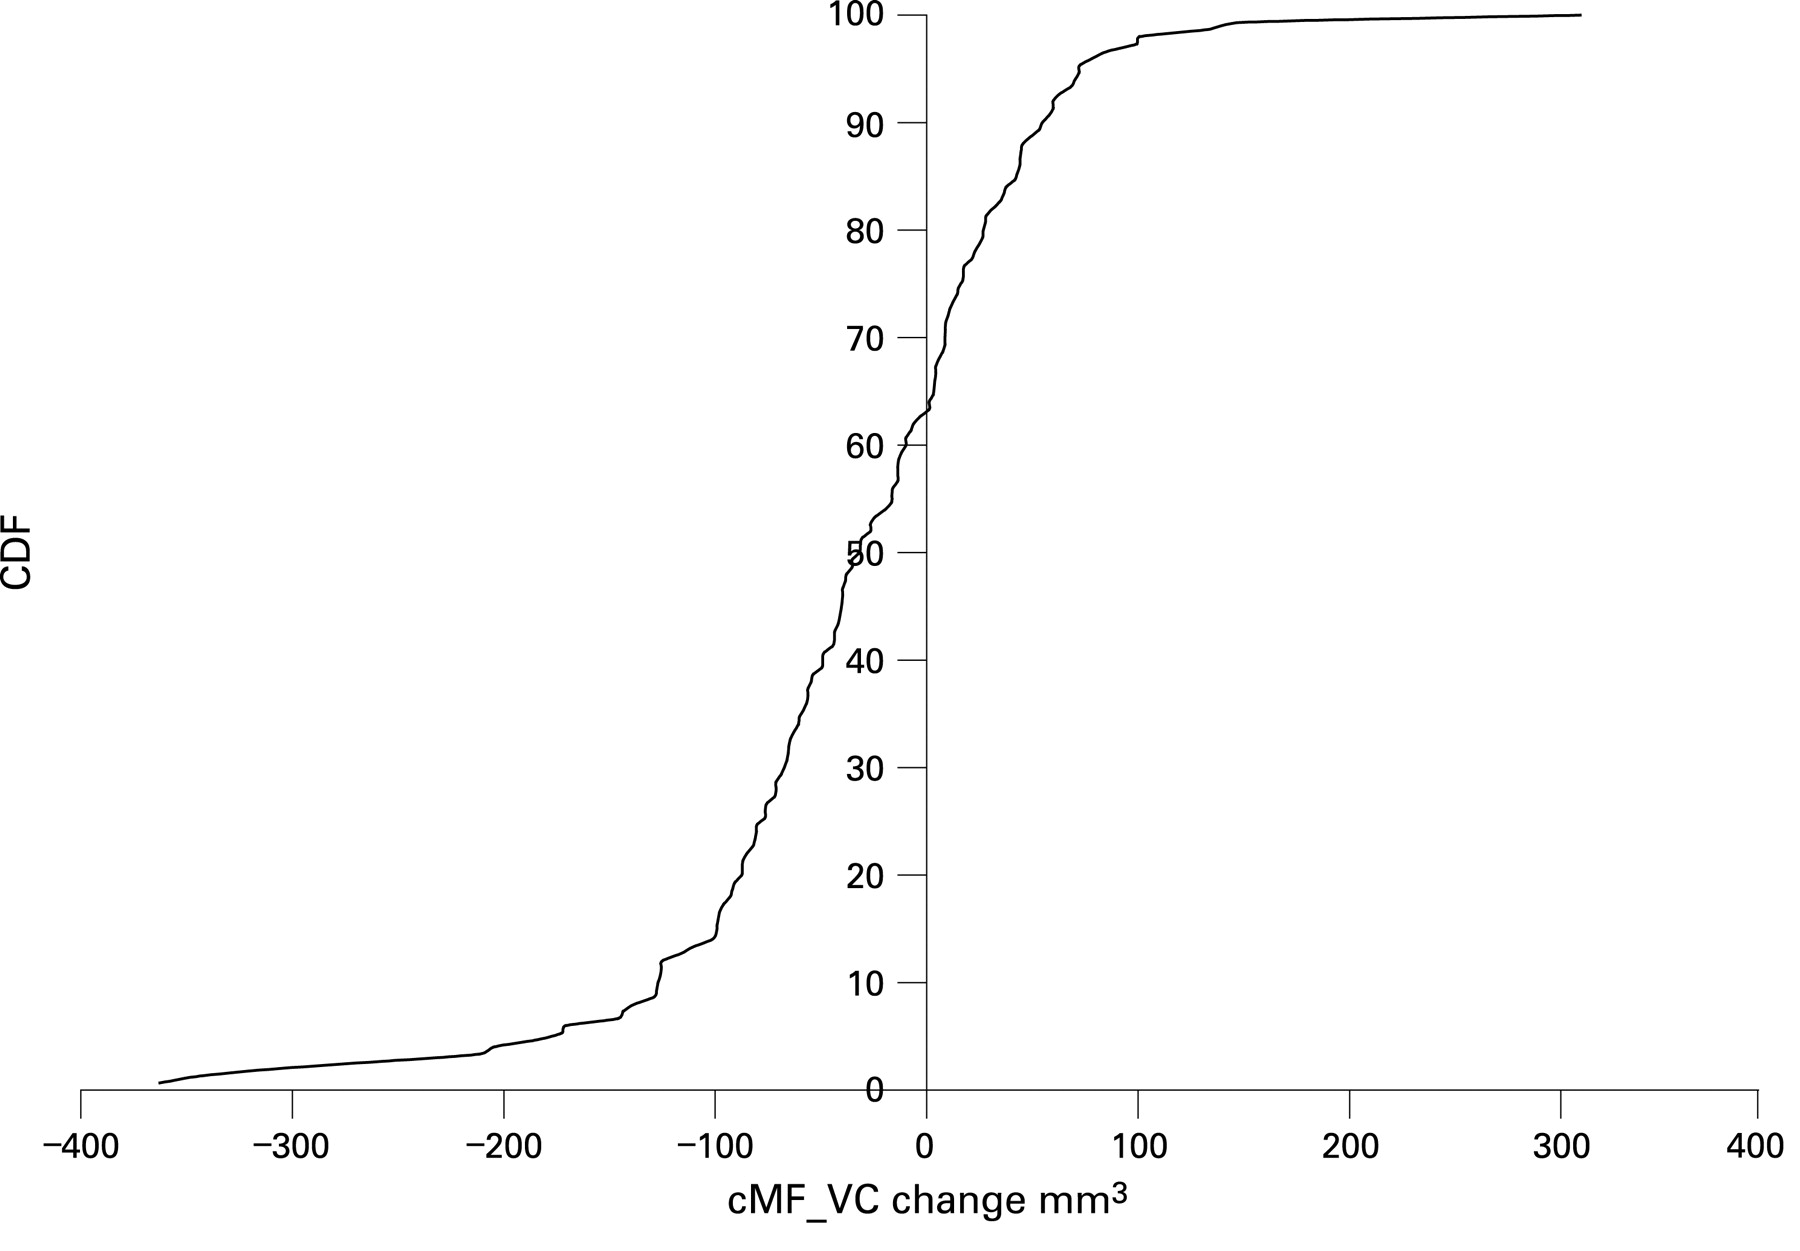
The rate of natural progression of the disease as measured by the change in the regular (non-normalised) cartilage volume, normalised cartilage volume, and denuded surface area over a period of 1 year within regions of the knee are depicted in tables 2–4. The results for cartilage volume and normalised cartilage volume are presented in tables 2 and 3. For example, the baseline and mean change in cartilage volume for the central medial femur are 1504.12 mm and −37.44 mm3 respectively, which gives an SRM of −0.394 or a percentage change of −2.46%. In the subsample (n = 116) of knees with K&L grade 2 or 3, the mean change is −33.94 mm3 and in those from the subsample (n = 59) in knees with K&L 2–4 and varus angulation, the mean change was −34.93 mm3. The SRMs vary across the different locations in the knee; however, in general they are small. The SRMs for cartilage volume of various locations are central medial tibia −0.096, central medial femur −0.394 and patella −0.198 (where a negative sign indicates cartilage loss). In general the SRMs for normalised cartilage volume are slightly less than those for cartilage volume. The SRMs for normalised cartilage volume of the various locations are central medial tibia −0.044, central medial femur −0.338 and patella −0.193. In general, the results for the subsample analyses for participants at higher risk for progression are similar to the whole sample. The distribution of change in cartilage volume and normalised cartilage volume for the central medial femur is shown in figs 1 and 2.

The results for the denuded surface area are presented in table 4, with a positive value representing increasing denuded area. The majority of participants had a denuded area at baseline in the central medial femur (62%) (fig 3) and central medial tibia (60%). Again the central medial femur demonstrated more change than the other cartilage plates with an SRM of 0.239.

DISCUSSION
The OAI is a longitudinal cohort study that has among its aims to assess the validity of MRI-derived morphology biomarkers for OA disease progression. We used state-of-the-art analysis methods to analyse numerous morphological biomarkers in articular cartilage from MRI. This paper presents descriptive results of cartilage morphometry and its change at the 1-year time point from the first substantive MRI data release from the OAI progression subcohort. In general, the annualised rates of change are small with the central medial femur showing the greatest consistent change.
The longitudinal change from the participants in this study is smaller than the majority of values published in previous longitudinal studies, which typically demonstrated about 5% loss of knee cartilage volume per year (range of about −1 to −8%) in knees with OA5 This then raises questions regarding differences between the study protocols or analysis technologies, which may explain very different rates of progression. The methods in previous studies differ markedly from those described here, including that they use a completely manual method of tracing boundaries for segmentation, analysis is read unblinded to time point order, have acquired images using 1.5T scanners and a different pulse sequence to that used here. However, our results are consistent with recent data from other studies using similar cartilage quantification techniques that showed cartilage volume loss of about −1 to −3% per year (including MAK,17 Pfizer18 and more recently data by Eckstein et al from OAI).19 These more recent studies have generally found rates of loss similar to what we have found in the medial tibia and femoral plates. If these more recent estimates of cartilage volume change are confirmed, then there are important implications for future clinical trials of disease-modifying treatments for OA using MRI techniques.
While significance tests are frequently used to assess change they do not indicate the magnitude of change. To give greater meaning to the amount of change the concept of responsiveness was introduced. The term responsiveness is used as an indicator of sensitivity to change. There are many responsiveness indicators that result in different effect size indices. Most of these indicators agree on the numerator (change from baseline to follow-up); however, there is little agreement on the appropriate denominator. Effect sizes greater than 0.2 are generally held to be clinically detectable.20 Cohen20 came up with conventions for these values that constitute a “trivial” (ES <0.20), small (ES ⩾0.20 <0.50), medium (ES ⩾0.50 <0.80), and a large effect (ES ⩾0.80). There is more controversy over the interpretation of other indices of responsiveness, including SRMs; however, if we were to generalise, the SRMs in this analysis are trivial to small.
The percentage change is calculated as change divided by baseline measure, so change and percentage change always have the same sign for each individual. However, their means in the population may not necessarily have the same sign. When the mean of change was calculated, each subject’s change was weighted with 1/sample size and summarised. However, when the mean of percentage change was calculated, each subject’s change was weighted with 1/(baseline measure×sample size) and summarised.
Several structure modification studies have based their sample size estimates on MRI-based rates of volume change of about 5% with an SD of 5% per year in knee cartilage volume. Projected sample size depends on: (1) the expected rate of progression in participants treated with placebo; (2) the minimum magnitude of the drug effect, or rate of progression expected in the active treatment arm(s); (3) the variation in progression rate that occurs between participants; and (4) the precision of the measurement technique. In a simple analysis of change from baseline, to detect a 50% reduction in loss of baseline cartilage volume over 1 year requires evaluable data on 64 participants per arm if the expected background progression is 5% (SD 5%), but 250 per arm if it is 5% (SD 10%) (for 80% power, α (two-sided) 0.05).9 A modest within-subject correlation of ρ = 0.7 would reduce the sample size by a factor of 2.3. However, change on the order of 1% (SD 10%) as observed in this study would require a prohibitively large sample size (N∼6400/arm) until the correlation reaches values on the order of 0.99. If these estimates of cartilage change are confirmed, then for MRI to be a useful tool with which to study OA progression then it will be necessary to develop more sensitive algorithms to detect structural change in the joint, and identify study populations undergoing more rapid disease progression.
How can we explain that the cartilage volume of some regions remains the same while the denuded areas appear to be increasing? Cartilage volume and thickness changes aggregate areas of cartilage swelling with separate areas experiencing a reduction in thickness, reducing the ability of these summary measures to identify change. In early OA, cartilage may not be thin but instead is thicker and swollen with water, which is imbibed by cartilage when the collagen network is disrupted and the role of proteoglycans is altered.21 22 Increasing thickness may also reflect a healthy trophic response to focal loading for normal cartilage as distinct from early disease. Thus measuring cartilage volume or mean thickness in regions of the knee (eg, medial tibia) and regional mean thickness may provide a very different measure of important pathological change when compared with focal measures of change centred around focal defects in diseased joints.23 Further, these measures cannot assess the composition of cartilage that can be measured using MRI techniques to ascertain alteration in proteoglycan and collagen content that may accompany swelling of cartilage.24 Distinguishing the MRI measures that are the most sensitive to change and are correlated with clinical symptoms is essential if we are to utilise them appropriately. Future work with this data set will investigate the association of MRI morphology measures with clinical symptoms. Moreover, we plan to estimate the cartilage loss involving partial and complete thickness focal cartilage defects.
As seen in previous studies, the variability in femoral cartilage volume measures (especially the posterior femoral condyles) is greater than other knee compartments potentially reflecting difficulties with lack of contrast among tissues in this region or due to partial volume effects in this curved surface.
This study has several limitations. The MRI postprocessing technique used every other slice as opposed to every slice. We anticipate a slight improvement in precision if each slice is used in the analysis. Another potential limitation is that we quantified cartilage morphometry using the DESSwe sequence rather than the more standard FLASH sequence, although the former has been cross-validated with the latter.25 The automated, pairwise image segmentation process we used imposes a bias on cartilage thickness and volume measurements, and is a unique feature of our methodology. Paired image analysis is typically more precise than unpaired image analysis, and biases imposed by these processes need to be presented and accounted for in analysis. The relative advantages of our analysis methods will require independent segmentation and quantification of these images by alternative image analysis techniques.
The separation of the cartilage tissue into several compartments introduces noise into the region of interest measurements. Without this subdivision it is impossible to report localised changes in the central femur, and the analysis, therefore, the ability to detect changes will be minimised. On the other hand, the segmentation of cartilage plates was done using an automated process that only increases marginally the measurement error.
The original description of the K&L grade was made and developed on weight bearing, fully extended films not on films that were semi-flexed such as in this study.
The sample used in this analysis had a smaller cartilage change than reported in other populations. One likely explanation is that cartilage change is greater in subjects with more advanced OA. 24 of 150 (16%) of our sample were participants with K&L grade 0 and 1, effectively a population without definitive radiographic OA (but with persistent knee pain). In other studies the greatest change in cartilage morphology has been seen in those with K&L grade 3 disease. Further, the sample in this study is heterogeneous with respect to whether the medial or lateral compartment is primarily involved in OA. Mediolateral frontal knee alignment has been shown to be a significant risk factor for disease progression in the primarily loaded tibiofemoral knee compartment.26 We plan to conduct further studies of this population and evaluate whether enriching the sample for certain features that predict progression such as meniscal damage, bone marrow lesion and alignment will facilitate identification of a cohort of persons at risk for greater progression.
In summary, the rates of change of cartilage morphometry in people with knee OA in this study are small. These results need to be replicated and published by other investigators using other image analysis tools and software algorithms. Our results should stimulate discussion as to which MRI parameters should be measured in longitudinal studies of OA progression and how best to perform these measurements. The greater complexity and cost of MRI joint morphology will need to prove its value.
Acknowledgments
We would like to thank the Principal Investigators (Michael Nevitt, Kent Kwoh, Charles B. Eaton, Rebecca Jackson, Marc Hochberg, Joan Bathon), Co-investigators and staff of the Osteoarthritis Initiative. I would also like to acknowledge the following persons who contributed to this work: Piran Aliabadi (read the knee x-ray films) and David Felson (chaired the x-ray adjudication sessions). Would like to acknowledge the input of Merck statisticians Yevgen Tymofyeyev and Amy Ko, David Raunig from Pfizer, and Randall Smith from GSK.
REFERENCES
Supplementary materials
web only appendix 68/3/349
Files in this Data Supplement:
Footnotes
Competing interests: None.
Funding: The OAI is a public–private partnership comprised of five contracts (N01-AR-2-2258; N01-AR-2-2259; N01-AR-2-2260; N01-AR-2-2261; N01-AR-2-2262) funded by the National Institutes of Health, a branch of the Department of Health and Human Services, and conducted by the OAI Study Investigators. Private funding partners include Merck Research Laboratories; Novartis Pharmaceuticals Corporation, GlaxoSmithKline; and Pfizer, Inc. Private sector funding for the OAI is managed by the Foundation for the National Institutes of Health.
The Osteoarthritis Initiative and this pilot study are conducted and supported by the National Institute of Arthritis and Musculoskeletal and Skin Diseases (N01-AR-2-2262, N01-AR-2-2262, N01-AR-2-2258) in collaboration with the OAI Investigators and Consultants. This manuscript has been reviewed by the OAI Publication committee for scientific content and data interpretation.
▸ An additional appendix is published online only at http://ard.bmj.com/content/vol68/issue3