Article Text

Abstract
Objective: To demonstrate the association between various measures of spinal mobility and radiographic damage of the spine in individual patients with ankylosing spondylitis, and to determine whether the assessment of spinal mobility can be a proxy for the assessment of radiographic damage.
Methods: Radiographic damage was assessed by the mSASSS. Cumulative probability plots combined the radiographic damage score of an individual patient with the corresponding score for nine spinal mobility measures. Receiver operating characteristic analysis was performed to determine the cut off level of every spinal mobility measure that discriminates best between the presence and absence of radiographic damage. Three arbitrary cut off levels for radiographic damage were investigated. Likelihood ratios were calculated to explore further the diagnostic properties of the spinal mobility measures.
Results: Cumulative probability plots showed an association between spinal mobility measures and radiographic damage for the individual patient. Irrespective of the chosen cut off level for radiographic progression, lateral spinal flexion and BASMI discriminated best between patients with and those without structural damage. Even the best discriminatory spinal mobility assessments misclassified a considerable proportion of patients (up to 20%). Intermalleolar distance performed worst (up to 30% misclassifications). Lateral spinal flexion best predicted the absence of radiographic damage, and a modified Schober test best predicted the presence of radiographic damage.
Conclusion: This study unequivocally demonstrated a relationship between spinal mobility and radiographic damage. However, spinal mobility cannot be used as a proxy for radiographic evaluation in an individual patient.
- AS, ankylosing spondylitis
- AUC, area under the curve
- BASMI, Bath Ankylosing Spondylitis Metrology Index
- BASRI, Bath Ankylosing Radiography Index
- LR, likelihood ratio
- MRI, magnetic resonance imaging
- mSASSS, modified Stoke Ankylosing Spondylitis Spinal Score
- NPV, negative predictive value
- PPV, positive predictive value
- ROC, receiver operating characteristic
- radiographic damage
- spinal mobility
- ankylosing spondylitis
Statistics from Altmetric.com
- AS, ankylosing spondylitis
- AUC, area under the curve
- BASMI, Bath Ankylosing Spondylitis Metrology Index
- BASRI, Bath Ankylosing Radiography Index
- LR, likelihood ratio
- MRI, magnetic resonance imaging
- mSASSS, modified Stoke Ankylosing Spondylitis Spinal Score
- NPV, negative predictive value
- PPV, positive predictive value
- ROC, receiver operating characteristic
The hypothesis that radiographic damage of the spine in patients with ankylosing spondylitis (AS) is associated with impairment of spinal mobility has been confirmed by several studies.1–4 However, these studies investigated the relationship at a group level. The association between structural damage and various instruments to assess spinal mobility in the individual patient has, to our knowledge, never been reported. Because radiographic evaluation is a burden for the patient (radiation exposure), the physician (time consuming), and society (costly), we investigated whether assessment of spinal mobility might be used as a proxy for the assessment of radiographic damage in individual patients.
The aim of this study therefore was twofold: (a) to demonstrate an association between various measures of spinal mobility and radiographic damage of the spine in individual patients and (b) to determine whether assessment of spinal mobility might be used to replace radiographic evaluation of the spine.
PATIENTS AND METHODS
Patients
This study was performed in the OASIS cohort, an international, observational study on outcome in AS which has been described in detail before.5 Originally, 217 consecutive outpatients from four centres in the Netherlands, Belgium, and France were included in this cohort. Table 1 presents demographic data, radiographic damage, and spinal mobility of the patients.
Patient characteristics of the OASIS cohort at baseline (n = 199)
Films
Films were scored by the modified Stoke Ankylosing Spondylitis Spine Score (mSASSS)6 by one observer (AW). In previous studies it was shown that this method had a good inter- and intraobserver reliability6–8 and good discriminatory properties.8
Spinal mobility measures
Nine measures were performed: chest expansion, finger to floor distance, occiput to wall distance, tragus to wall distance, modified Schober, lateral spinal flexion, cervical rotation, intermalleolar distance, Bath Ankylosing Spondylitis Metrology Index (BASMI): this index is calculated using cervical rotation, tragus to wall distance, lateral spinal flexion, modified Schober, and intermalleolar distance.9 Each of the five BASMI measurements is divided into 11 equal sections,10 the mean of the five scores producing a BASMI score from 0.0 to 10.0.
For all measures, the best of two attempts is recorded, and rounded at 0.1 cm, except for cervical rotation (1 degree) and BASMI (rounded at one decimal).
Analysis
To demonstrate an association between spinal mobility and radiographic damage, combined scatter and cumulative probability plots were created for spinal mobility with radiographic damage. These plots combine every individual radiographic damage score with the corresponding score for each of the nine spinal mobility measures. The individual mSASSS scores of all patients are plotted in cumulative order (from the lowest value starting at zero to the highest value ending at 100%). The combined procedure yields a scatter plot (observations of two variables combined), in which the value of one of the variables (mSASSS) is plotted against its cumulative frequency. Correlations at a group level were expressed as Spearman’s correlation (rs).
Receiver operating characteristic (ROC) analysis was performed to determine the cut off level for every spinal mobility measure that discriminated best (highest accuracy) between the presence and absence of radiographic damage. Three arbitrary cut off levels for radiographic damage were investigated: 0, 3, and 6 mSASSS units. Sensitivity measured the ability of every spinal mobility measure to truly indicate radiographic damage. Specificity measured the ability of every spinal mobility measure to truly indicate the absence of radiographic damage. It was considered that the area under the ROC curve (AUC-ROC) represented the discriminatory power of the spinal mobility measure (an AUC-ROC of 0.5 means “no discriminatory power” and an AUC-ROC of 1.0 means “ideal discriminatory power”). Likelihood ratios (LRs) for a positive test result (abnormal spinal mobility measure; LR+) and for a negative test result (normal spinal mobility measure; LR−) were calculated to explore further the diagnostic properties of individual and combined (BASMI) spinal mobility measures.
To investigate whether radiographic damage could be predicted accurately on the basis of spinal mobility measures, post-test probabilities of the absence or presence of radiographic damage were calculated making use of Bayes’s theorem (post-test odds on radiographic damage = LR+ × pre-test odds on radiographic damage).11
RESULTS
Table 1 presents the patient characteristics, as well as the radiographic damage scores and the scores for all nine spinal mobility measures and the BASMI.
Of the total cohort of 217 patients, complete data were available for 199 patients. For the purpose of this study, it is important that the individual values of both the radiographic and the spinal mobility measures cover a range that is as broad as possible. It can be seen from table 1 that OASIS includes both patients with normal spinal mobility and no radiographic damage, as well as patients with severely impaired levels of spinal mobility and high degrees of radiographic structural damage. The distribution pattern of all spinal mobility measures can be deduced by interpreting the mean and median values.
Figure 1 presents detailed scatter plots of the individual mSASSS scores in cumulative order versus the nine spinal mobility measures. To better illustrate the information that is provided by this type of scatter plot, we discuss the relation between lateral spinal flexion and mSASSS as an example (fig 1G). The probability plot of the mSASSS scores (squared symbols) visualises that 30% of the patients has an mSASSS of 0 units, that the median mSASSS score is 5.0, and that a minority of patients have very high scores, reaching up to a maximum of 72 units in a few patients. Every mSASSS score is combined with the corresponding value for lateral spinal flexion (round symbols) in that patient (one x axis value has two y axis values) that can be read from the second y axis. An examination of the distribution pattern of the lateral spinal flexion scores now shows that the pattern converges from wide distribution (high level of dispersion) in the case of normal mSASSS scores (left side of the graph) to narrow distribution (low level of dispersion) in the case of the highest mSASSS scores (right side of the graph). Or rephrased: lateral spinal flexion can range from entirely normal to highly abnormal if radiographic damage is absent, but lateral spinal flexion is almost always abnormal if radiographic damage is severe.
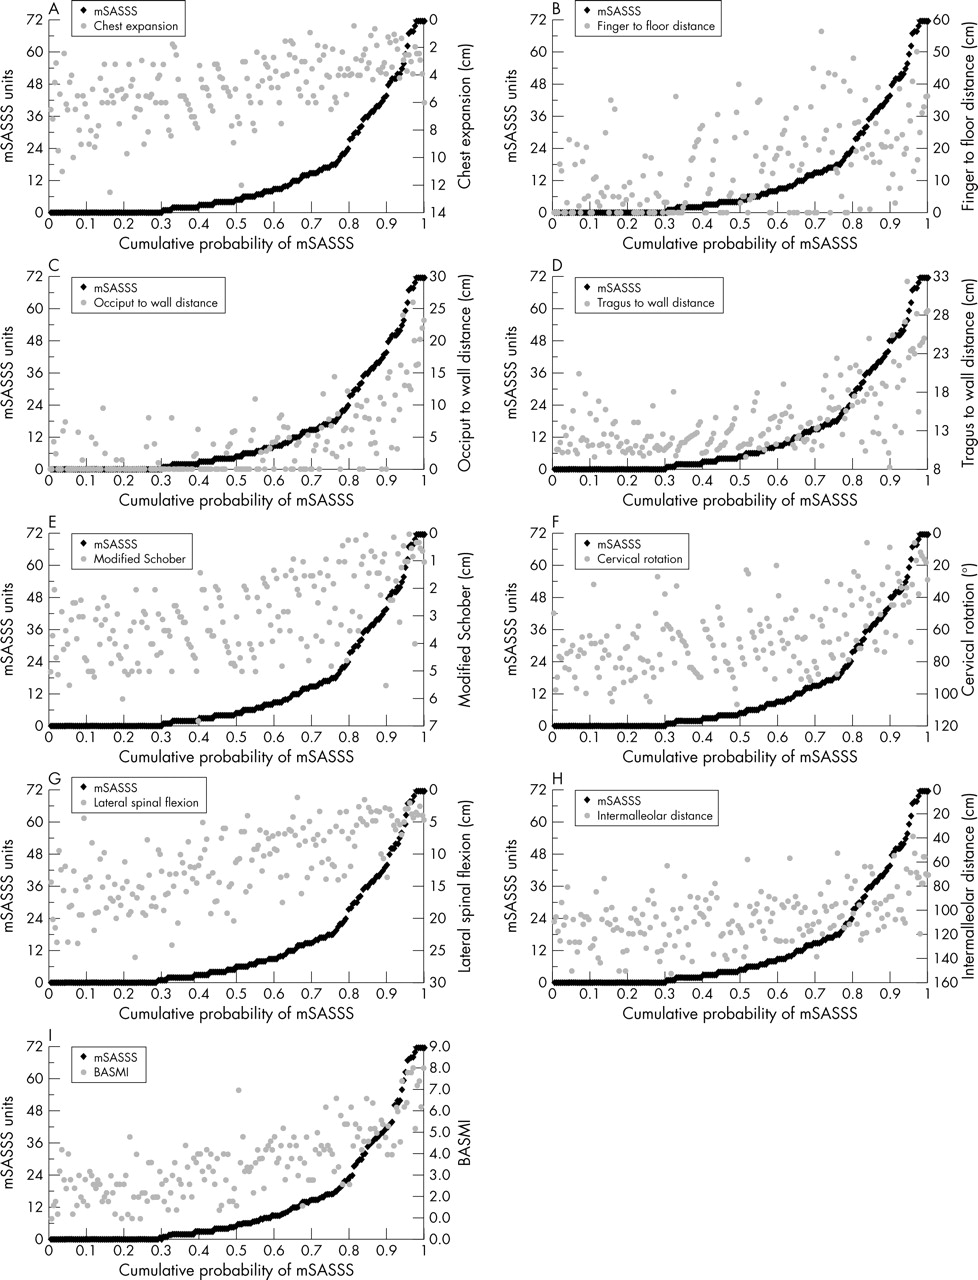
Cumulative probability plots of mSASSS versus spinal mobility measures. (A) mSASSS versus chest expansion; (B) mSASSS versus finger to floor distance; (C) mSASSS versus occiput to wall distance; (D) mSASSS versus tragus to wall distance; (E) mSASSS versus modified Schober; (F) mSASSS versus cervical rotation; (G) mSASSS versus lateral spinal flexion; (H) mSASSS versus intermalleolar distance; (I) mSASSS versus BASMI.
Some of the spinal mobility measures (chest expansion, finger to floor distance) more or less reflect the same kind of relationship. Other spinal mobility measures, however, show different relationships. Tragus to wall and occiput to wall distance (twice the same concept) do not converge: absence of radiographic damage does not rule out abnormal spinal mobility, and vice versa. Only in the case of a very high mSASSS score are both spinal mobility measures impaired. Intermalleolar distance and Schober’s test have a somewhat different pattern: highly abnormal levels are lacking when there is no damage, and in turn, normal levels are lacking when damage is high.
Altogether, the data suggest that spinal mobility assessed with various instruments can be impaired by radiographic damage as well as by other unrelated processes, and the relation between impaired spinal mobility and radiographic damage is only strong when radiographic damage is high.
Table 2, which presents the statistically significant Spearman’s correlation coefficients at a group level, with correlations ranging from −0.42 (intermalleolar distance) to 0.76 (BASMI), also provides information about an association between spinal mobility and radiographic damage.
Spearman correlations of spinal mobility and mSASSS scores*
Table 2 presents, additionally, the correlations of the separate components (cervical and lumbar) of the mSASSS with the spinal measures. As might be expected the correlation of the part that corresponds with the spinal mobility measure is higher than the correlation of the part that does not correspond—for example: the modified Schober measures the mobility of the lower lumbar spine, correlation with mSASSS lumbar rs = −0.64 versus mSASSS cervical rs = −0.40.
To obtain a better insight into the effect of a different cut off level for radiographic damage, we here discuss one example of the relation between radiographic damage and spinal mobility in detail. Figure 2 shows three scatter plots of the cumulative mSASSS versus modified Schober. In each plot two lines are drawn. The vertical line indicates the cut off level for the modified SASSS, which was predefined, and set at 0, 3, and 6 mSASSS units respectively. From the figures it can be seen that according to a cut off level of 0, 70% of the patients have radiographic damage. According to a cut off level of 3 mSASSS units, the prevalence of radiographic structural damage is 56%, and according to a cut off level of 6 units, the prevalence is 45%. The horizontal line indicates the cut off level providing the highest accuracy for the modified Schober (ROC analysis). Note that the optimal cut off level for the modified Schober is dependent on the chosen cut off level for radiographic damage.

Cumulative probability plots for mSASSS versus modified Schober with cut off points for mSASSS and modified Schober creating four quadrants. (A) cut off mSASSS >0; (B) cut off mSASSS >3; (C) cut off mSASSS >6.
By drawing both cut off levels in the scatter plots, four quadrants arise. In the right upper quadrant of fig 2A, all patients are represented who have an abnormal Schober test (⩽2.3) and radiographic damage (mSASSS >0; true positives: 33%). In the left lower quadrant of fig 2A, all patients are represented with a “normal” (for this population) Schober test (>2.3) and no radiographic damage (mSASSS = 0; true negatives: 28%). In the right lower quadrant are the patients with a normal modified Schober test but with radiographic damage (false negatives: 37%). In the right upper quadrant are the patients with an abnormal Schober test but without radiographic damage (false positives: 2%). These percentages can be used to calculate sensitivity (true positive rate) and specificity (true negative rate) of the spinal mobility assessment for discriminating between the absence and presence of radiographic damage.
Figure 2 shows that if a higher cut off level for radiographic damage is chosen, the percentage of true positives decreases as expected (from 33% to 26%), whereas the percentage of true negatives increases (from 28% to 53%). The false positive rate remains about the same (2%–5%), but the percentage of false negatives becomes smaller (from 37% to 19%) because of the increase of the true negatives. Obviously, even at the highest achievable level of accuracy, significant numbers of patients are falsely classified as having normal or abnormal x ray findings of the spine, irrespective of the chosen cut off level for radiographic damage.
For the modified Schober an LR+ of 5.7 and an LR− of 0.6 was found for a radiographic cut off level of 0 (table 3).
Measurement properties of spinal mobility with radiographic damage set as the “gold standard”
Because post-test probability relates to LR+ (post-test odds = LR+ × pre-test odds), this means that finding an abnormal Schober’s test (⩽2.3 cm) increases the likelihood of radiographic damage from 0.70 to 0.93 (but is found in only 33% (true positives) of the patients). The value 0.93 is also called the positive predictive value (PPV). A normal modified Schober test (>2.3 cm) decreases the likelihood of abnormal x ray findings of the spine from 0.70 to 0.43 (but is found in only 28% (true negatives) of the patients). The value 0.43 is called the negative predictive value (NPV).
If the PPV and NPV are calculated with data from table 3 or percentages mentioned in figs 2B and 2C it can be seen that the PPV for a modified Schober test with a cut off point for mSASSS of 3 = 0.88 (post test probability from 0.56 to 0.88) and the NPV is 0.61, for a cut off of mSASSS >6 the PPV = 0.93 and NPV = 0.71.
Table 3 summarises the results of the ROC analysis and the determination of LRs for three different cut off points of modified SASSS set as the “gold standard”. For the gold standard defined at mSASSS >0 the AUC values range from 0.68 for intermalleolar distance to 0.85 for BASMI, which indicates that every spinal mobility measure to some extent differentiates between the absence and presence of radiographic damage. The corresponding levels of sensitivity and specificity, however, differed importantly between all spinal mobility measures: sensitivity was highest for lateral spinal flexion 0.84 and lowest for Schober’s index 0.47; specificity was highest for Schober’s index 0.92 and lowest for cervical rotation 0.73.
As a consequence of variability in sensitivity and specificity, LR+ and LR− differed markedly across spinal mobility measures. For mSASSS >0 set as golden standard the LR+ is highest for Schober’s test (5.7) and lowest for cervical rotation (2.4); the LR− is lowest (which means most discriminatory) for lateral spinal flexion (0.2) and highest for Schober’s index (0.6).
Corresponding information can be found in table 3 for the two other cut off points (mSASSS >3 and >6). Although the absolute values of the AUC, sensitivity, and specificity differ with various cut off levels, the relationship between the various spinal mobility measures remains constant. The BASMI composite index did not perform better than lateral spinal flexion, irrespective of the chosen cut off level for radiographic damage, but BASMI and lateral spinal flexion performed better than the other spinal mobility measures.
Table 4 shows that for all investigated cut off levels for radiographic damage a significant percentage of patients are misclassified.
Percentage true positives and negatives, and false positives and negatives for measurement properties of spinal mobility, with radiographic damage set as the gold standard”
DISCUSSION
This study demonstrates that assessing spinal mobility cannot be a proxy for the assessment of spinal structural damage by radiography. Even the spinal mobility measure with the highest level of accuracy still misclassifies a significant number of patients as having or not having radiographic damage. This observation does not dispute the concept that radiographic damage is associated with a decreased spinal mobility. Significant correlations were found for mSASSS scores and spinal mobility measures at a group level (highest correlation for lateral spinal flexion and BASMI). However these correlation coefficients relate to the entire group, and are disproportionably influenced by small numbers of observations with both high structural damage scores and strongly impaired spinal mobility, as shown by the probability plots. The probability plots show unequivocally that for an individual patient the association between spinal mobility measures and radiographic damage can be very variable.
Of all spinal mobility measures, the intermalleolar distance had the lowest correlation with radiographic damage. An explanation for this might be that intermalleolar distance assesses mobility in the hip joint, whereas the mSASSS only assesses the spine. Correlation coefficients also disguise the phenomenon of variability in spinal mobility in the absence of structural damage. And lastly, high correlation coefficients do not necessarily indicate a high level of discriminatory power for an individual patient, as was shown here. In other words, not every patient with radiographic structural damage has reduced spinal mobility, and not every patient with reduced spinal mobility has radiographic damage. This finding suggests that both the assessment of spinal mobility and radiographic assessment have an additive place in the outcome measurement of AS.
The considerable number of patients falsely classified as having or not having radiographic damage deserves some further explanation. Patients without radiographic damage but with impaired spinal mobility (false positives) may have other structures affected that are not visualised by radiography (inflammation of soft tissue, for example), or structural damage (for example, in the thoracic spine or zygapophyseal joints) not captured with the mSASSS. Impairment of spinal mobility due to inflammation is underlined by the observation in clinical trials that tumour necrosis factor blocking treatment may increase spinal mobility after only a few months of treatment. Another limiting factor may be that the mSASSS only takes structural damage in the anterior site of the lumbar and cervical spine into account. Exclusion of the thoracic spine and of the posterior site of the spine may result in an underestimation of true structural damage, which causes limitation of spinal mobility but is not picked up by the mSASSS. Also, exclusion of the facet joints, which have a major role in spinal mobility, may result in an underestimation. de Vlam et al found a relationship between involvement of the facet joints and the presence of syndesmophytes, suggesting that the facet joint is primarily affected.12 Other structures that are not incorporated in the mSASSS are the anterior and posterior ligaments. If a ligament shows ossification, but no structural damage of the vertebrae is seen, then a normal mSASSS score will be assigned to this patient, while the patient may experience severe limitation of spinal mobility. So, the mSASSS is certainly not a perfect score to represent all possible radiographic abnormalities. The Bath Ankylosing Radiography Index (BASRI) incorporates more abnormalities, but the BASRI is a rather rough method, and correlation coefficients for BASRI scores and measures of spinal mobility were no better than those found in this study.8
Magnetic resonance imaging (MRI) can visualise both soft tissue and bone. Further, MRI can visualise inflammatory activity, as well as the chronic irreversible damage that is typically seen on x ray examination of the spine. Because involvement of soft tissue may be an important factor determining spinal mobility, it would be of interest to investigate the correlation between both inflammatory activity (soft tissue) and structural damage (bone) assessed by MRI, and spinal mobility in future research.
Part of the explanation of normal spinal mobility in the presence of significant radiographic damage (“false negatives”) is formed by the choice of the cut off point for radiographic progression. It was seen that with a higher cut off point for radiographic damage the cut off point for the spinal mobility measure indicated a worse value. Conceivably, a patient with a minimal mSASSS score (for example an mSASSS of 2) which indicates sclerosis, or erosions or squaring on two vertebrae or one syndesmophyte and no involvement of other structures, does not have limited spinal mobility.
There are also a number of patients with high mSASSS scores, indicating that at least part of the spine has severe structural damage, who still have a good spinal mobility. This group of patients is small but does exist. Apparently, patients can compensate for impaired mobility due to severe structural damage in parts of the spine to a certain degree. Obviously, however, patients with the highest levels of radiographic damage (patients at the ceiling of the scoring range) all experience severely impaired mobility, which adds to the validity of the construct that radiographic damage compromises spinal mobility.
We investigated whether the results that we found for the discriminatory power of several spinal mobility measures were sensitive to the predefined cut off level for radiographic damage. This question is relevant because many investigators in this field will dispute the reliability of a cut off level for radiographic damage equal to 0. Because scoring radiographic damage is prone to all sources of measurement error and biases that may move the structural damage score towards higher levels, a cut off level >0 might be considered more realistic. However, although we found several small differences in the performance of spinal mobility measures, the general picture was similar, irrespective of the chosen cut off level for radiographic damage.
We think that the arbitrary selection of cut off levels of mSASSS >3 and mSASSS >6 were a good choice. Setting the cut off level higher than mSASSS >6 was not appropriate because the median of the mSASSS scores was at 5.0, therefore a cut off point much higher than the median would omit the majority of patients; 55% of patients had a score of mSASSS of 6 units or lower.
A theoretical limitation of this study may be that the results are only valid within the OASIS cohort. We do not believe that external validity is jeopardised here, because OASIS includes unselected, consecutive patients with AS, and we have shown here that the entire range of spinal mobility impairment and radiographic damage is actually included in the cohort.