Article Text

Abstract
OBJECTIVE Wegener’s granulomatosis (WG) is an inflammatory disorder characterised by granulomatous inflammation, vasculitis, and necrotising vasculitis and is strongly associated with anti-neutrophil cytoplasmic antibodies (ANCA). Activated monocytes/macrophages are present in renal biopsy specimens and participate in granuloma formation by synthesising and secreting a variety of chemoattractants, growth factors, and cytokines. In view of these findings, in vivo monocyte activation was evaluated in patients with WG and the findings related to parameters of clinical disease activity.
METHODS Monocyte activation was analysed by measuring plasma concentrations of soluble products of monocyte activation, that is neopterin and interleukin 6 (IL6), by ELISA, and by quantitating the surface expression of activation markers on circulating monocytes by flow cytometry.
RESULTS Twenty four patients with active WG were included in this study. Ten of these patients were also analysed at the time of remission. Twelve patients with sepsis served as positive controls, and 10 healthy volunteers as negative controls for monocyte activation. Patients with active disease had increased monocyte activation compared with healthy controls as shown by increased concentrations of neopterin (p <0.0001) and increased surface expression of CD11b (p < 0.05) and CD64 (p < 0.05). In those patients with increased concentrations of IL6 during active disease plasma concentrations of IL6 decreased during follow up when patients went into remission (p < 0.0001). In addition, neopterin (r = 0.37, r = 0.44), IL6 (r = 0.37,r = 0.60) and CD63 expression (r = 0.39, r = 0.45) correlated significantly with disease activity as measured by the Birmingham Vasculitis Activity Score and C reactive protein values, respectively. Compared with patients with sepsis, all markers of monocyte activation in patients with vasculitis were lower.
CONCLUSION It is concluded that disease activity in WG correlates with the extent of activation of monocytes, compatible with their role in the pathophysiology of this disease.
- anti-neutrophil cytoplasmic antibody
- monocyte activation
- vasculitis
- flow cytometry
Statistics from Altmetric.com
Wegener’s granulomatosis (WG) is an inflammatory disorder of presumed autoimmune origin characterised by granulomatous inflammation of the respiratory tract, necrotising vasculitis, and glomerulonephritis. This disease is strongly associated with anti-neutrophil cytoplasmic antibodies (ANCA). ANCA in this disorder are directed against proteinase 3 (Pr3), myeloperoxidase (MPO), and/or, occasionally, human leucocyte elastase (HLE).1
Although the pathophysiological role of ANCA in WG has not yet been fully elucidated, several lines of evidence suggest that ANCA are involved in the development of WG. Firstly, relapses of WG are frequently preceded by a rise in ANCA titre and can be prevented by treatment based on changes in those titres.2 Secondly, in vitro, ANCA have the potential to activate primed neutrophils to the production of reactive oxygen species and the release of lytic enzymes,3 ,4 and to activate and damage cultured endothelial cells.5-7 Priming with tumour necrosis factor α (TNFα) and cytochalasin B,3 ,4 or TNFα in combination with interleukin 8,8 induces surface expression of ANCA antigens on the neutrophil cellsurface, which become then available for interaction with ANCA. Subsequently, ANCA can interact with their respective antigens as well as with Fc receptors, especially the second Fc receptor, on the neutrophil cellsurface, which leads to neutrophil activation.9 ,10
Most studies have focused on the capacity of ANCA to induce neutrophil activation. Apart from neutrophils, however, monocytes/macrophages also play a pivotal part in lesions development in WG. Monocytes/macrophages are found in renal biopsy specimens from patients with WG.11 Activated monocytes/macrophages participate in particular in granuloma formation, characteristically found in patients with WG, by synthesising and secreting a variety of chemoattractants, growth factors and cytokines.12Furthermore, monocytes/macrophages may induce vascular damage by the production and secretion of reactive oxygen radicals and lytic proteases. Monocytes also contain the ANCA antigens Pr3 and MPO in their granules. Like neutrophils, they express ANCA antigens upon priming,13 which subsequently may initiate a process of cell activation similar as has been described for neutrophils after interaction with ANCA. Indeed, it has been demonstrated that monocytes produce increased concentrations of monocyte chemoattractant protein 1 (MCP1)14 or interleukin 8,13 or both, upon stimulation with ANCA.
As WG is a systemic disease, several groups have hypothesised that neutrophils from patients with WG are already activated in the circulation.8 ,15 Recently, Haller et al suggested that monocytes are also activated in the circulation.16 They demonstrated increased integrin expression on both circulating neutrophils and monocytes from patients with active WG. They did not, however, investigate the expression of ANCA antigens on circulating monocytes nor did they investigate monocyte activation in relation to disease activity.
In view of the recent in vitro data showing that ANCA can activate monocytes, we evaluated in vivo monocyte activation in patients with WG by analysing the levels of soluble products of monocyte activation, such as interleukin 6 (IL6) and neopterin, in the plasma of patients with WG. These soluble products of monocyte activation reflect the state of activation of both tissue monocytes/macrophages as well as circulating monocytes. In addition, we measured the expression of monocyte activation markers and ANCA antigens on circulating monocytes. We related the results to parameters of clinical disease activity to define their clinical relevance.
Methods
PATIENTS AND CONTROLS
The patient group consisted of 24 consecutive patients admitted to our hospital or seen at the outpatient clinic with a diagnosis of WG. Twelve consecutive patients with sepsis served as positive controls for leucocyte activation. Sepsis was defined as previously described.17 Healthy laboratory personnel served as normal controls.
DIAGNOSTIC CRITERIA
The diagnosis of WG was established according to clinical and histological criteria18 and all patients fulfilled the American College of Rheumatology (ACR) criteria for this disease.19 Patients with active disease were grouped as: (a) patients with newly developed disease (N), and (b) patients with relapsing disease (R). Relapsing disease was defined as previously described.2 ,20 Table 1 gives the criteria for relapsing disease. Patients with newly developed disease were studied before treatment was started. Patients with relapsing disease were studied before treatment was instituted or intensified. Complete remission was defined as the absence of signs or symptoms attributable to active vasculitic disease.
Criteria for relapsing disease20
DISEASE ACTIVITY SCORING
Disease activity was measured according to the Birmingham Vasculitis Activity Scoring index (BVAS),21 whereas damage was measured according to the Vascular Damage Index.22
ANCA DETECTION
ANCA were detected by indirect immunofluorescence on ethanol fixed granulocytes as previously described23 using FITC labelled goat antihuman IgG (Dako, Denmark) in a 1:50 dilution. Test or control serum samples were tested in a dilution of 1:20, and further at twofold dilutions. Slides were read by two independent observers, and a titre ⩾ 40 was considered positive.
The specificity of ANCA for either Pr3, MPO or HLE was detected by capture ELISA as previously described.24
Anti-lactoferrin antibodies were detected by ELISA on plates directly coated with lactoferrin (5 μg/ml, Sigma, St Louis, MA, USA) as described.25 Serum samples were considered positive for one of the aforementioned specificities when values exceeded the mean + 2 standard deviations of normal controls (n = 50).
ANALYSIS OF MONOCYTE ACTIVATION
Neopterin ELISA
Values of neopterin, a plasma marker for monocyte activation,26-29 were measured by using a commercially available ELISA (Brahms Diagnostica, Germany). In brief, serum samples were mixed with the neopterin/alkaline phosphatase conjugate in uncoated microtitre plates. This mixture was then transferred to a sheep polyclonal anti-neopterin coated microtitre plate and incubated for two hours at room temperature in the dark. The wells were then washed thoroughly and the substrate (4-nitrophenylphosphate) incubated for 30 minutes at room temperature. Finally, the reaction was stopped by the addition of 2M NaOH. Plates were read at 405 nm. As reference, a standard curve, ranging from 2–250 nmol/l was used. Linear range of the neopterin ELISA ranged from 2 to 250 nmol/l. The sensitivity of this test is 2 nmol/l.
Interleukin 6 ELISA
IL6 concentrations, a parameter for monocyte activation,28 ,29 were analysed by ELISA, according to Helle et al 30with modifications. In brief, microtitre plates (Costar nr 9018, the Netherlands) were coated overnight at room temperature in phosphate buffered saline (PBS) with a monoclonal antibody against human IL6 (CLB.MIL6/16, Central Laboratory of Blood transfusion services (CLB), Amsterdam, the Netherlands) at a dilution of 1:500. After washing with 0.025 M TRIS-HCL, 0.15 M NaCl and 0.05% Tween 20, plates were blocked with 2% bovine serum albumin (BSA)/0.05% Tween 20 in PBS for one hour at room temperature. As reference, recombinant IL6 was used (highest concentration: 2000 pg/ml). Subsequently, patient and healthy control plasma samples (twofold dilutions) were incubated for two hours. Wells were then washed and a biotinylated sheep polyclonal antibody against human IL6 was added (CLB.SIL6-D, CLB, Amsterdam) at a dilution of 1:3000, one hour at room temperature in the dark. IL6 was then detected by the addition of streptavidin poly-horseradish peroxidases (CLB, M2032 STREPTA-E+) for 30 minutes, room temperature, in the dark. Finally, plates were washed and the colour reaction was initiated by the addition of substrate (tetra methyl benzidine (TMB), and H2O2, 20 minutes).The colour reaction was stopped by adding 100 μl/well of 1M H2SO4. Plates were then scanned at 450–575 nm. Linear range of the IL6 ELISA ranged from 15 to 2000 pg/ml. The sensitivity of this test is 15 pg/ml.
Monocyte surface marker analysis by flowcytometry
To avoid in vitro activation of leucocytes we used a whole blood method31 as described previously.32 In brief, EDTA anticoagulated blood was kept on ice until sample preparation. Sample preparation was started always within five minutes after blood sampling. All steps were performed in Hanks’s balanced salt solution (HBSS) without calcium and magnesium (Gibco, Life Technologies Ltd, Paisley, Scotland, UK), supplemented with 1% BSA, Boseral, Organon Teknika, Boxtel, the Netherlands). Cells were fixed with 1% paraformaldehyde in PBS for 10 minutes on ice, washed, followed by two times erythrocyte lysis with lysis buffer (155 mM NH4Cl, 10 mM KHCO3, 0.1 mM Na2EDTA.H2O) for five minutes at 37°C. A panel of monoclonal antibodies to leucocyte surface antigens was used for the analysis of monocyte activation (table 2).33 The first antibody was incubated for one hour at 4°C. After washing, the cells were incubated with a goat antimouse Ig polyclonal antibody conjugated with phycoerythrin (Southern Biotechnology Associates Inc, Birmingham, USA), supplemented with 5% normal goat serum and 5% normal human serum, 1:20 diluted, for 30 minutes at 4°C in the dark. Subsequently, cells were washed and stored until flow cytometric analysis was performed.
Activation markers on monocytes
Analysis of surface marker expression was performed on a Coulter Epics ELITE flow cytometer (Coulter, Hiaelea, Florida, USA), the same day or occasionally the next day (within 18 hours). When the cell pellet contained erythrocytes, the intercalating dye, LDS751 (Exiton Chemical, Dayton, Ohio, USA) was added before flow cytometric measurement. Erythrocytes could successfully be excluded from the leucocyte population in the LDS751/forward scatter dotplot, when combined with a lifegate. Monocytes were identified by forward and sideward scatter. Data were analysed using Immuno-4 software.34
In the first experiments, QC3 beads (Flow Cytometry Standards, Leiden, the Netherlands) were used to calibrate the flow cytometer. However, these beads appeared not to be stable during the study period. In addition, batch to batch quality varied remarkably. Therefore, we decided to compare the results obtained in patients with the results obtained in healthy, age matched volunteers that were measured simultaneously.
The expression of surface markers was calculated as a mean fluorescence intensity (MFI), corrected for non-specific binding of an irrelevant antibody and the conjugate (NSB), in combination with the percentage of positive cells (pos %). Data were expressed as a percentage of the value obtained from the healthy control who was tested in parallel, according to the following formula:

To assess the variability of the normal population, 10 controls were analysed simultaneously. Their individual data were expressed as a percentage of the mean of the healthy control population.
OTHER ASSAYS
C reactive protein (CRP) concentrations were measured by using a particle enhanced nephelometric method and NA latex CRP reagents (Behring, Marburg, Germany).
STATISTICAL ANALYSIS
Groups were analysed for differences in surface expression by means of the Kruskal-Wallis test. Subsequently, differences between groups were analysed by the Mann-Whitney test. Correlation between parameters was analysed by the Spearman rank correlation test. The paired Wilcoxon test was used to test differences between paired observations. These tests were performed by using GraphPad Instat2 Software. A two tailed p value < 0.05 was considered to indicate statistical significance.
Results
PATIENTS
Twenty four patients (11 male, 13 female, mean age 53, range 23–85) with active WG—that is, either with newly developed disease (n = 12) or with relapsing disease (n = 12)—were included in this study. Additionally, 10 of these patients were analysed also at the time of quiescent disease, when a complete remission had been obtained. Tables3 and 4 give the patient characteristics.
Clinical and serological findings in 24 patients with WG
Patient characteristics
SOLUBLE MARKERS OF MONOCYTE ACTIVATION
Neopterin is secreted in large quantities by activated monocytes/macrophages upon activation.26 In patients with active disease neopterin values were higher compared with healthy controls (p < 0.05) and tended to be higher compared with patients with quiescent disease (p = 0.07). Analysis of paired samples showed that plasma concentrations of neopterin in patients with active disease were not different compared with neopterin values during remission. In patients with sepsis plasma concentrations of neopterin were increased compared with healthy controls (p < 0.0001) (fig1).
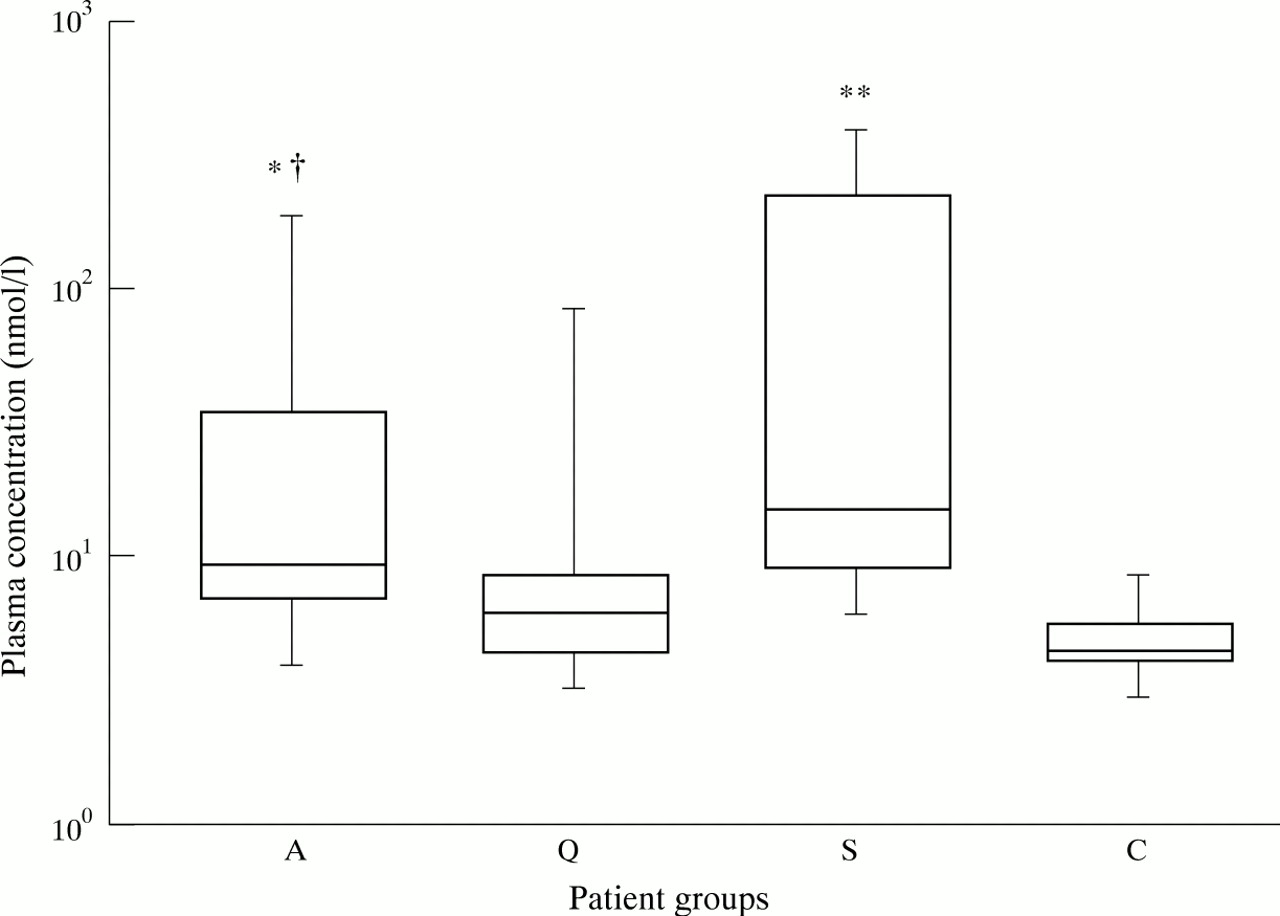
Box and whisker plots indicating the overall range (error bars), 25–75% range (boxes), and median value (horizontal lines) of neopterin plasma concentrations in patients with WG (A: active disease, Q: quiescent disease) compared with concentrations in patients with sepsis (S) and healthy controls (C). * p < 0.05, ** p < 0.0001 compared with healthy controls, † p = 0.074 compared with quiescent disease.
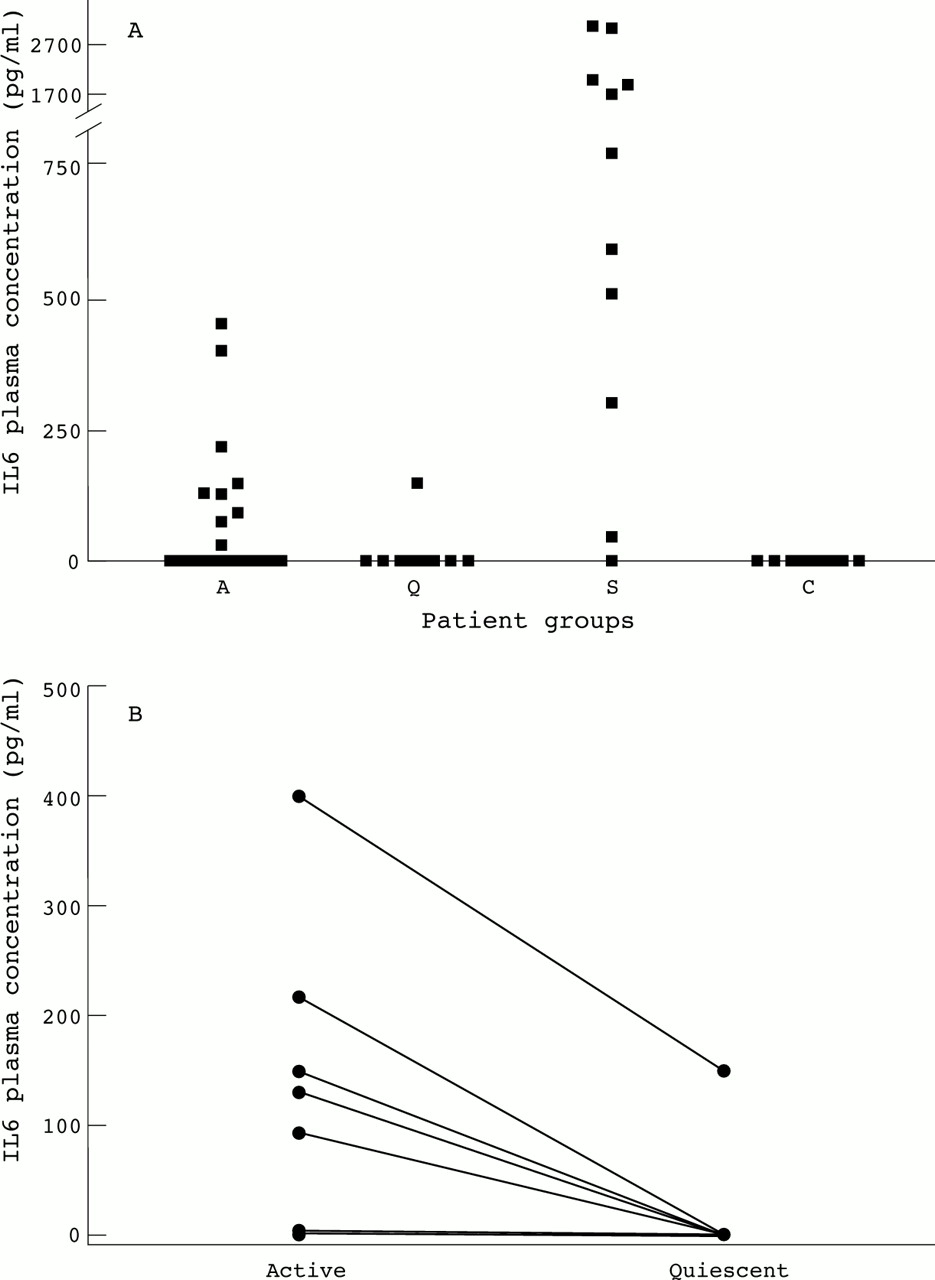
IL6 concentrations did not differ between patients with active and quiescent disease, nor between patients with active disease and healthy controls, although a broad range of IL6 concentrations in patients with active disease was observed (fig 2A). Nine patients with active disease, one patient with quiescent disease and none of the controls had detectable concentrations of IL6 (p < 0.0001, active WGv healthy controls). Patients who had detectable IL6 concentrations had higher CRP values (p <0.005) than patients without detectable IL6 plasma concentrations. In patients with newly diagnosed disease concentrations of IL6 tended to be higher compared with patients in remission (p = 0.06) and healthy controls (p = 0.06) (fig 2A). Analysis of paired samples showed that plasma concentrations of IL6 in patients with active disease were higher compared with IL6 levels during remission (p< 0.0001) (fig 2B). In patients with sepsis plasma concentrations of IL6 were highly increased compared with healthy controls (p < 0.001).

(A) A dot blot of the plasma concentrations of IL6 in 24 patients with WG (A: active disease, open squares represent 12 patients with newly diagnosed disease, closed squares represent 12 patients with relapsing disease, Q: quiescent disease, 10 patients) compared with concentrations in 12 patients with sepsis (S) and healthy controls (C). (B) Paired observations of IL6 plasma concentrations in 10 patients with active and quiescent disease. p<0.0001.
EXPRESSION OF ACTIVATION MARKERS ON MONOCYTES
As the expression of CD63 is increased upon degranulation of monocytes,35 we studied the expression of CD63 on circulating monocytes from patients with WG.
Monocytes from patients with active disease showed a tendency to a higher expression of CD63 compared with healthy controls (p = 0.08). Compared with patients in remission no differences were found. Analysis of paired data showed that CD63 expression in patients with active disease was not different compared with CD63 expression during remission. Monocytes from patients with sepsis showed a higher expression of CD63 than healthy controls (p < 0.0001). Results are shown in figure 3A.

(A) Box and whisker plots of the surface expression CD63 on monocytes from patients with WG (A: active disease, Q: quiescent disease) compared with the expression on cells from patients with sepsis (S) and healthy controls (C). † p = 0.0787, ** p < 0.0001 compared with healthy controls. (B) Box and whisker plots of the surface expression of CD11b on monocytes from patients with WG (A: active disease, Q: quiescent disease) compared with the expression on cells from patients with sepsis (S) and healthy controls (C). * p < 0.05, ** p < 0.0001 compared with healthy controls. (C) Box and whisker plots of the surface expression of CD64 on monocytes from patients with WG (A: active disease, Q: quiescent disease) compared with the expression on cells from patients with sepsis (S) and healthy controls (C). * p < 0.05 compared with healthy controls.
Upon leucocyte activation the expression of CD11b, the α subunit of Mac-1, an adhesion molecule involved in cell adhesion and transmigration, is increased. Therefore, the expression of CD11b on monocytes was measured to analyse monocyte activation.
CD11b expression was increased on monocytes from patients with active disease compared with monocytes from healthy controls (p < 0.05), but did not differ from the expression on monocytes from patients with quiescent disease. Analysis of paired data showed that CD11b expression in patients with active disease was not different compared with CD11b expression during remission. CD11b expression on monocytes from patients with sepsis was clearly increased compared with healthy controls (p < 0.0001). Data are represented in figure 3B.
VLA-4 expression on monocytes did not differ between patients with various stages of disease activity and healthy controls. In addition, the expression of VLA-4 on monocytes from patients with sepsis, was not significantly different compared with healthy controls.
The first Fc gamma receptor, CD64, is expressed constitutively on monocytes and its expression is increased upon activation.36 Compared with healthy controls, patients with active disease had an increased expression of CD64 on monocytes (p < 0.05).When compared with patients in remission, no differences in CD64 expression were found. Analysis of paired data showed that CD64 expression in patients with active disease was not different compared with CD64 expression during remission. Monocytes from patients with sepsis showed increased expression of CD64 (p < 0.05) compared with healthy controls. Results are shown in figure 3C.
EXPRESSION OF ANCA ANTIGENS ON MONOCYTES
On monocytes the expression of ANCA antigens is increased in vitro when cells are primed with cytokines.13 To evaluate whether circulating monocytes in vivo also express ANCA antigens on their cell surface, we measured the expression of ANCA antigens on monocytes of patients and controls.
Circulating monocytes from patients and healthy controls expressed MPO and Pr3, whereas the expression of HLE was low or absent. The expression of Pr3, MPO, or HLE on monocytes did not differ significantly between the various groups of patients and healthy controls, although individual patients had increased expression of Pr3 and/or MPO. A flow cytometry histogram of Pr3 and MPO expression on monocytes from a patient with active disease is shown in figure 4. Monocytes from patients with sepsis showed an increased expression of Pr3 compared with the expression on monocytes from healthy controls (p < 0.05).

Flow cytometry histogram representing membrane expression of Pr3 and MPO and the negative control staining on monocytes from a patient with active WG and a healthy control. Cell count and the mean fluorescence intensity (MFI) are depicted on the y and x axes respectively.
CORRELATIONS WITH MARKERS OF DISEASE ACTIVITY
Correlations were found between soluble markers of monocyte activation and disease activity: Both neopterin levels and IL6 levels of patients with detectable IL6 levels correlated with the BVAS score (r = 0.3664, p < 0.05 andr = 0.8096, p < 0.0001, respectively) and CRP values (r = 0.4437, p < 0.001, andr = 0.7385, p < 0.001).
In addition, membrane expression of CD63 on circulating monocytes correlated with the BVAS score (r = 0.3937, p < 0.05) and CRP values (r = 0.4489, p < 0.01) (fig 5).

Surface expression of CD63 on monocytes (expressed as expression index, see methods) correlate with disease activity as expressed by the BVAS score (A) or CRP values (B).
Next, we compared soluble markers of monocyte activation with cellular expression of activation markers on circulating monocytes. Surface expression of CD63 correlated with IL6 (r = 0.4393, p < 0.05) but not with levels of neopterin.
To detect a possible effect of treatment, we analysed whether there was a relation between the use of corticosteroids or cytotoxic agents, or both, on the one hand and the levels of expression of activation markers on the other hand. No such a relation could be detected.
Discussion
In this study we demonstrated monocyte activation in patients with WG by analysing soluble products of activated monocytes, in particular neopterin and IL6, and the membrane expression of activation markers on circulating monocytes. Plasma concentrations of neopterin as well as surface expression of CD11b and CD64 on circulating monocytes were increased in patients with active disease compared with healthy controls. In addition, levels of neopterin and IL6 and the surface expression of CD63 on monocytes correlated with disease activity. Thus, monocytes are already activated in the circulation, and may eventually participate in granuloma formation and generalised vasculitis in patients with WG.
In this study, we found increased levels of neopterin in patients with active WG. As neopterin plasma concentrations may be influenced by renal clearance,37 we also calculated neopterin/serum creatinine ratios and still found increased levels of neopterin in patients with WG compared with healthy controls that correlated with parameters of disease activity (data not shown). Increased plasma concentrations of neopterin in patients with WG correlating with disease activity were also demonstrated by Nassonovet al.38 In addition, Nassonovet al showed that during follow up neopterin concentrations paralleled the course of disease activity in these patients.
Plasma concentrations of IL6 did not differ between the various stages of disease. This was mainly because of the broad range of IL6 concentrations in patients with active disease. Nine patients with active disease had detectable levels of IL6 and these concentrations were correlated with disease activity. In addition, patients who had detectable IL6 levels had higher CRP values than patients without detectable IL6 plasma levels. Furthermore, in patients with newly diagnosed disease levels of IL6 tended to be higher compared with patients in remission and healthy controls. During follow up plasma levels in these patients decreased to normal values.
Thus, monocyte activation, as reflected by the release of soluble products, corresponds to the clinical expression of the disease.
Plasma levels of neopterin and IL6 reflect the state of activation of both extravasated monocytes/macrophages as well as circulating monocytes, whereas the surface expression of activation markers reflect the state of activation of circulating monocytes only.
Therefore, the extent of cell activation of circulating monocytes was also analysed in this study by the measurement of surface expression of several monocyte activation markers. The expression of CD63 tended to be increased on monocytes from patients with active disease compared with healthy controls, indicating that degranulation of azurophilic granules, in which MPO and Pr3 are stored, has occurred. Degranulation of azurophilic granules is thought to be the initial step for the expression of ANCA antigens on the cell surface of both neutrophils and monocytes, but also for “planting” those antigens at the endothelial cell surface. In addition, if degranulation occurs in the vicinity of the endothelial lining, this may result in endothelial damage because of the release of lytic enzymes and oxygen radicals. In this study, we demonstrated that the extent of degranulation, as measured by CD63 expression, correlated with disease activity.
Upon activation, the expression of several adhesion molecules, including CD11b and VLA-4, on monocytes increases. CD11b is expressed on most leucocytes, whereas VLA-4 is mainly expressed on monocytes, lymphocytes and eosinophils.39 VLA-4 is a ligand for the vascular cell adhesion molecule, VCAM-1, on endothelial cells. The interaction of VLA-4 with VCAM-1 is thought to be of importance for adhesion to, and transmigration through the endothelium, in particular by monocytes. Transmigrated monocytes may participate in granuloma formation. We found an increased expression of CD11b on circulating monocytes from patients with active disease, but the expression of VLA-4 on monocytes was not increased. During activation, integrins, like CD11b and VLA-4, demonstrate increased affinity towards their respective ligands.40 CD11b, however, also demonstrates an increased avidity, as the number of CD11b molecules on the cell surface increases upon cell activation. In our study, the anti-CD11b and the anti- VLA-4 monoclonal antibody used for membrane detection could not distinguish between “high” and “low” affine integrins. As fully activated monocytes, expressing high affine VLA-4 and/or CD11b, adhere to the endothelium, these adherent cells cannot be detected anymore in the circulation. Furthermore, Stegeman et al 41 demonstrated increased levels of soluble VCAM in patients with WG, whereas levels of soluble ICAM-1 were only slightly increased. This may indicate that, in patients with WG, the VLA-4/VCAM-1 interaction plays a more important part than the CD11b/ICAM-1 interaction.
The expression of CD64 (the first Fc γ receptor) was increased on monocytes from patients with active disease compared with healthy controls. Fc gamma receptors are essential for monocyte activation by ANCA as was recently demonstrated by Ralston et al 13 when using Fab or F(ab)2 fragments of anti-Pr3 antibodies. As monocytes themselves contain the ANCA antigens Pr3 and MPO, these antigens can be expressed at the cellsurface. In vitro, this has been recently demonstrated by Ralton et al.13
In this study, we found that the expression of CD63, CD11b and CD64 on circulating monocytes from patients with active WG were increased compared with healthy controls, but were lower than the expression on monocytes from patients with sepsis. Thus, compared with patients with sepsis, monocyte activation in patients with vasculitis is mild.
The stronger correlations found between soluble markers of monocyte activation and disease activity in patients with WG may indicate that the activation of tissue macrophages rather than circulating, peripheral blood monocytes plays an important part in the pathogenesis of this disease.
This study demonstrated that, in vivo, monocytes are capable of expressing Pr3 and MPO. Pr3 and MPO expression on monocytes is essential for interaction with ANCA and subsequent activation by ANCA. Indeed, primed monocytes produce increased levels of MCP-1 and IL8 upon stimulation with ANCA in vitro.13 ,14 Both MCP-1 and IL8 are potent chemoattractants for monocytes and neutrophils. They may, therefore, play a part in the recruitment of (activated circulating) monocytes and neutrophils into evolving granulomas.12Furthermore, IL8 may stimulate PMNs to express Pr3,8thereby amplifying the effector phase in vasculitis. Expression of ANCA antigens on circulating monocytes can, however, be observed in the presence of ANCA in patients without active disease—that is, during quiescent disease. Therefore, other additional factors are probably involved in the activation of monocytes by ANCA.
From our data we hypothesise that monocytes in patients with WG may be primed as a result of stimulation by proinflammatory cytokines, which are locally released upon infections, which are often observed in these patients.42-44 Alternatively, priming of circulating monocytes may also result from cytokines released from inflammatory sites. Subsequently, primed monocytes are systemically activated because of stimulation by ANCA. These activated circulating monocytes adhere to and transmigrate through endothelial cells, which are also activated in WG.45 These transmigrated activated monocytes, then participate in granuloma formation and amplify inflammation by the production of MCP-1 or IL8, or both. These chemoattractants then attract a new influx of leucocytes.
In conclusion, disease activity in WG correlates with the extent of activation of monocytes, compatible with their role in the pathophysiology of this disease.
Acknowledgments
The authors wish to thank M G Huitema, W W Oost-Kort, I Bouwman, and G Mesander for their technical assistance, Drs J Zijlstra, C A Stegeman, and C F A Franssen for their clinical input, and Dr P C Limburg for his valuable advice.
References
Footnotes
Funding: this study was performed with the aid of departmental funds.