Article Text

Abstract
Objective To study the relationship of spinal inflammation and fatty degeneration (FD) as detected by MRI and new bone formation seen on conventional radiographs (CRs) in ankylosing spondylitis (AS).
Methods CRs at baseline, 2 years and 5 years and spinal MRIs at baseline and 2 years of 73 AS patients treated with infliximab in European AS Infliximab Cohort were available. Relative risks (RR) were calculated with a general linear model after adjustment for within-patient variation.
Results In a total of 1466 vertebral edges (VEs) without baseline syndesmophytes, 61 syndesmophytes developed at 5 years, the majority of which (57.4%) had no corresponding detectable MRI lesions at baseline. VEs with both inflammation and FD at baseline had the highest risk (RR 3.3, p=0.009) for syndesmophyte formation at 5 years, followed by VEs that developed new FD or did not resolve FD at 2 years (RR=2.3, p=0.034), while inflammation at baseline with no FD at 2 years had the lowest risk for syndesmophyte formation at 5 years (RR=0.8). Of the VEs with inflammation at baseline, >70% resolved completely, 28.8% turned into FD after 2 years, but only 1 syndesmophyte developed within 5 years.
Conclusions Parallel occurrence of inflammation and FD at baseline and development of FD without prior inflammation after 2 years were significantly associated with syndesmophyte formation after 5 years of anti-tumour necrosis factor (TNF) therapy. However, the sequence ‘inflammation–FD–new bone formation’ was rarely observed, an argument against the TNF-brake hypothesis. Whether an early suppression of inflammation leads to a decrease of the risk for new bone formation remains to be demonstrated.
- Ankylosing Spondylitis
- Magnetic Resonance Imaging
- Anti-TNF
Statistics from Altmetric.com
Introduction
Ankylosing spondylitis (AS) is a chronic inflammatory rheumatic disease that is characterised by spinal inflammation and new bone formation. The most characteristic feature of inflammation in the axial skeleton is bone marrow oedema as detected by a special sequence called short-tau inversion recovery (STIR) of MRI, which is currently considered the standard imaging technique for visualisation of sacroiliitis and spondylitis.1 In contrast, structural changes are currently assessed by conventional radiography,2 which is considered the gold standard for the detection of syndesmophytes and ankylosis—the characteristic features of the bone formation that occurs in the majority of patients with AS. Both MRI and X-rays are critical for classification and diagnosis of axial spondyloarthritis, including AS.1 ,3
While conventional treatment with non-steroidal anti-inflammatory agents (NSAIDs) is efficacious in many patients with AS, current recommendation is to prescribe tumour necrosis factor α (TNFα)-blocker agents when patients remain active despite optimised NSAID use.4 However, although spinal inflammation as detected by MRI is known to have some relationship with new bone formation in AS5–7 and these inflammatory lesions largely improve and are often undetectable after some months of treatment with anti-TNF agents,8 imaging subanalyses from several large clinical trials have suggested that new bone formation is not halted by this treatment over 2 years.9–13 In contrast, there is evidence that NSAIDs given continuously or in a high dosage have an inhibitory effect in the same period of time,14 especially in the group of patients with an elevated C-reactive protein (CRP).15 Nevertheless, a very recent analysis showed that radiographic progression in patients treated with anti-TNF for longer periods might still be decreased as compared with patients treated with NSAIDs only over the same time period.16
Retrospective data from a historical cohort have suggested that although radiographic progression in AS increases steadily in the population as a whole, about 25% of patients show significant variability, with periods of rather rapid radiographic progression in the course of disease,17 and some variability has also been found in anti-TNF-treated patients.3 Factors that may potentially be correlated with radiographic progression include the resolution of inflammation18 and/or the occurrence of fatty degeneration (FD)19 as described in patients on anti-TNF agents. According to a recent report, such evolution may be seen in the so-called ‘mature’ vertebral lesions, which are characterised by an inflammatory signal on MRI sequences associated with FD or sclerosis, which both may represent potential repair processes.20 In contrast, there may be other more acute lesions, which are characterised by an inflammatory signal only, without any signs of metaplasia of the surrounding bone tissue.20
According to the so-called ‘TNF-brake hypothesis,’ blocking TNFα with biologic agents may even stimulate new bone formation.6 This could potentially explain the dissociation between the improvement of disease activity, mobility and function on the one hand and new bone formation on the other, which have both been observed in patients.21
The most important factor to predict radiographic progression is the presence of syndesmophytes at baseline.3 ,22 This is in line with the observation that a longer symptom duration is associated with more severe radiographic outcomes in AS.23
In the present study, taking advantage of data and images from patients who participated in AS Study for the Evaluation of Recombinant Infliximab Therapy (ASSERT),24 and were then included in the European AS Infliximab Cohort (EASIC), an investigator-driven study,25 we were able to analyse MR images and conventional radiographs (CRs) obtained within a time frame of 5 years. The objective of this study was to study the relationship of spinal inflammation and FD as well as the combination of the different lesions as detected by MRI and new bone formation seen on CRs in AS. We were especially interested in the exact sequence of events in order to understand more about the pathogenesis of new bone formation in AS.
Patients and methods
The image sets used in this study were taken from patients from different European centres who had participated in EASIC. The study protocol of EASIC has been published elsewhere.25 Patients were treated continuously with infliximab over 5 years. The study protocol, including all imaging procedures, was approved by the local ethical committee of each participating centre in each country. All patients had given informed written consent before inclusion into the cohort. For this study, images of 73 patients were available. Only patients with complete imaging sets, including CRs of the cervical and the lumbar spine in the sagittal view at baseline (start of TNF-blocker treatment), and at years 2 and 5 of follow-up, as well as MR images at baseline and at year 2 were included.
Imaging protocols and processing of images
MRI
The original MRI protocol used for ASSERT8 was used for all subsequent imaging procedures performed during EASIC. Briefly, MRI examinations were performed in 1.0 Tesla or 1.5 Tesla MRI scanners with phased-array coils by using the following sequences: T1-weighted turbo spin-echo, slice thickness 3 mm (repetition time (TR) 500–700 ms and time to echo (TE) minimum accessible, depending on the capability of the machine) and STIR images with a slice thickness of 3 mm (TR 2000–4000 ms and TE 35–55 ms).
Conventional radiographs
Sagittal views of the cervical and the lumbar spine were obtained according to local standards at all time points.
All images were anonymised by an independent person and were assigned with a new unique study number for this EASIC substudy. Since this number was different from the patient numbers given in ASSERT and EASIC, the reading was performed blinded to patients’ demographic data. MRI and CRs were scored independently by the same experienced reader.
For the reading of radiographs and MR images, only the anterior parts of the cervical (C2 lower to T1 upper), the lumbar (T12 lower to SI upper) spine and the lower part of the thoracic spine were assessed. The parts of the thoracic spine, which were visible only on MRIs, were excluded from the evaluation due to insufficient imaging on the radiographs caused by the superimposed lung tissue.
The evaluation of MRI included the recording of (i) the presence/absence of inflammatory spinal lesions in STIR MRI sequences; (ii) the presence/absence of FD in the T1-weighted MRI sequences; and (iii) the presence/absence of syndesmophytes in CRs, all performed for all vertebral edges (VEs), see figure 1.
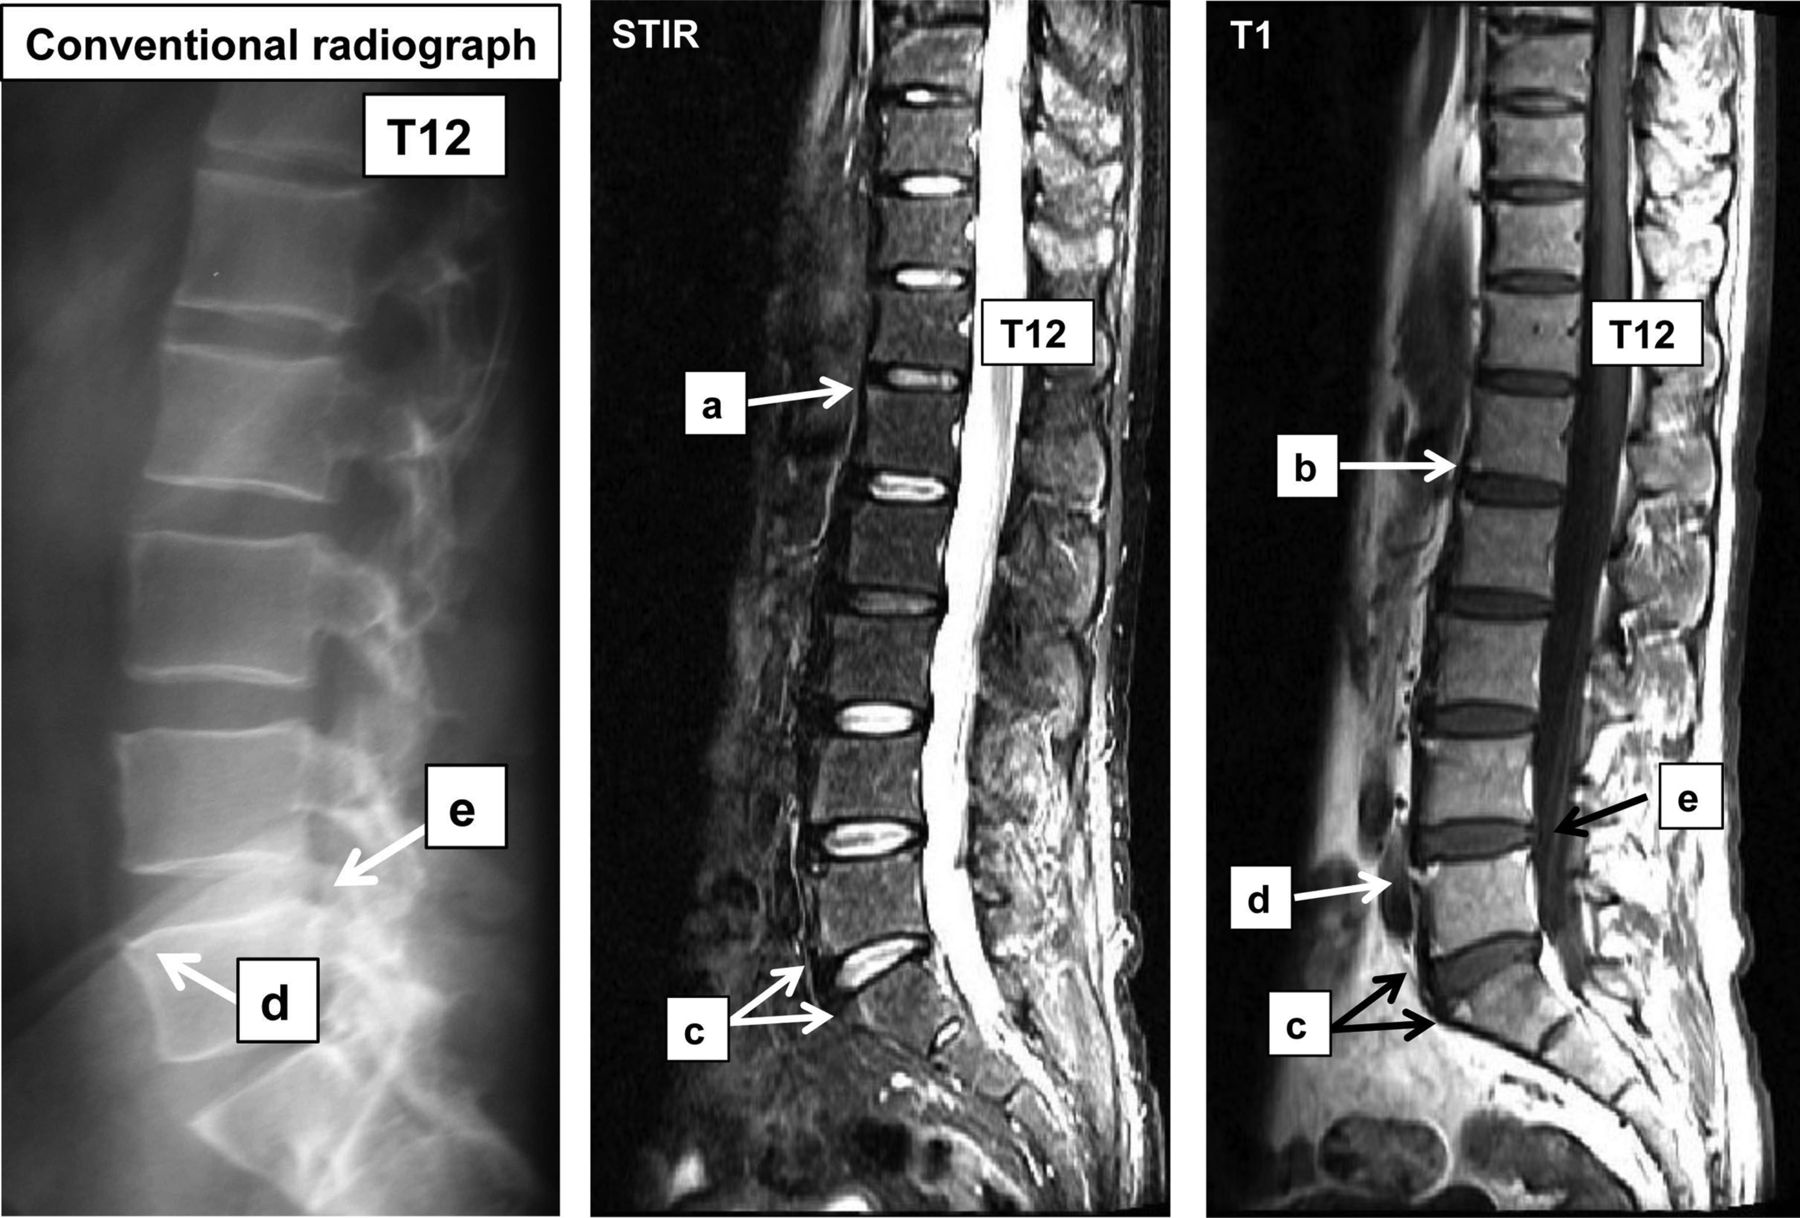
Typical examples of lesions that were included or excluded in this analysis, as seen on the short-tau inversion recovery (STIR)-MRI and T1-weighted MRI and the corresponding findings on a conventional radiograph (CR). ‘a’: inflammatory lesion without evidence of fatty degeneration (FD) (hyperintense on STIR-weighted MRI and hypointense on T1-weighted MRI); ‘b’: FD without evidence of inflammatory lesion (hypointense on STIR-weighted MRI and hyperintense on T1-weighted MRI); ‘c’: combination of inflammation and FD (hyperintense on both STIR-weighted MRI and T1-weighted MRI); ‘d’: fatty lesion combined with a syndesmophyte—these lesions were excluded from further analyses due to the occurrence of syndesmophytes already at baseline, also seen on the CR; and ‘e’: posterior edges with fatty degenerative lesions—these vertebral edges could not be included in the analysis due to insufficient imaging in CRs. ‘T12’: 12th vertebra of the thoracic spine.
Definitions of the different MRI lesions
In order to describe all possible findings that can be depicted by MRI, the following definitions were used:
-
inflammatory lesions only,
-
lesions characterised by FD only,
-
combination of inflammation and FD,
-
no MRI lesions visible.

Schematic description of the course of all possible MRI lesions or combinations, leading to syndesmophyte development after 5 years of anti-tumour necrosis factor α (‘Anti-TNFα’) therapy. INF+, inflammation on MRI; INF−, no inflammation on MRI; FD+, fatty degeneration on MRI; FD−, no fatty degeneration on MRI; Synd−, no syndesmophyte visible on conventional radiograph (CR); Synd+, newly developed syndesmophyte (as assessed by CR); STIR, short-tau inversion recovery sequence on MRI; T1, T1-weighted sequence on MRI. Percentages give the rate of lesions with inflammation resulting in different MRI combinations. *For calculations of relative risks, the development of syndesmophytes from vertebral edges that had no MRI lesions neither at baseline nor after 2 years was taken as a reference.
Definitions of radiographic lesions
Assessment of syndesmophytes and differentiation from degenerative changes such as spondylophytes was made according to a recent proposal, where the former are considered by showing a growth parallel to the anterior vertebral side/anterior intervertebral ligament while the latter are considered by showing a growth parallel to the horizontal line.3 However, the growth of these osteophytes was not measured for the purposes of the present study, but was based on clinical judgement of the readers.
Statistical analysis
The occurrence of MRI lesions at different time points was compared with the development of new syndesmophytes on conventional X-rays at all time points. The MRI lesions at baseline were related to the change observed in CRs after 2 and 5 years, while the MRI lesions recorded at 2 years together with the change of MRI lesions between baseline and 2 years were related to the change observed in CRs between baseline, 2 and 5 years. VEs with syndesmophytes at baseline were excluded from these analyses. The association between MRI findings and development of new syndesmophytes was investigated at the level of VEs by means of generalised estimation equation (GEE) models, where the information of VEs of each patient was correlated with each other but where the individual patients were included as independent units. A compound symmetry model was used to estimate the intercorrelations between VEs within patients. An adjustment for the presence or absence of syndesmophytes at any VE of a patient was made by including this parameter as covariable in the GEE model. Since sex was not associated with development of new syndesmophytes, this parameter was not included in the final GEE model.
Results
Baseline characteristics
The baseline characteristics of the 73 patients included in this EASIC substudy are shown in table 1. The baseline characteristics of the patients who had initially been included in ASSERT24 and of the patients who had initially been included in EASIC but did not complete the study were similar.25
Baseline characteristics of the 73 patients who were included in this MRI substudy
Radiographic findings
Overall, 2044 VEs were available for scoring, 459 of which had syndesmophytes at baseline (22.5%)—these VEs were excluded from the analyses related to future syndesmophyte development. Additional 119 VEs were excluded because of missing data. Thus, there were 1466 VEs left for the imaging analysis, 504 of which were in the cervical spine, 327 in the lower part of the thoracic spine and 635 in the lumbar spine.
Between baseline and year 2, a total of 35 new syndesmophytes developed and another 26 developed between year 2 and year 5, resulting in a total of 61 VEs with new syndesmophytes (4.2% of all VEs available for analysis) over the observation period. Of the 35 new syndesmophytes after 2 years, 12 (34.4%) were found in VEs of the cervical spine, 9 (25.7%) in VEs of the thoracic spine and 14 (40%) in VEs of the lumbar spine. Of the 61 new syndesmophytes after 5 years, 20 were found in the cervical spine (4% of all available cervical VEs), 17 in the thoracic spine (5.2% of all available thoracic VEs) and 24 in the lumbar spine (3.8% of all available lumbar VEs) (p between spinal segments = NS).
MRI findings in VEs with syndesmophytes at baseline
In the 459 VEs with syndesmophytes at baseline, MRI showed inflammation only in 44 VEs (9.6%), FD only in 201 VEs (43.8%) and a combination of inflammation and FD in 56 VEs (12.2%), while 158 VEs (34.4%) had no MRI lesions detectable.
Retrospective analysis of VEs with new syndesmophytes at 2 and 5 years
Out of 61 new syndesmophytes at year 5, the majority (n=35, 57.4%) developed in VEs that had neither inflammatory nor fatty lesions on the baseline MRI, while 14/61 (23%) developed from VEs that had inflammation (with or without FD), and 22 new syndesmophytes developed from VEs that had FD (with or without inflammation) on the baseline MRI (36.1%).
In more detail, only 4 new syndesmophytes developed from inflammatory changes only on MRI (6.6%), 12 new syndesmophytes (19.7%) developed from fatty degenerative changes only and 23 (16.4%) new syndesmophytes after 5 years developed from the combination of inflammatory and fatty degenerative MRI changes. However, the majority (n=20, 57.1%) of the 35 syndesmophytes that had developed after 2 years and of the 61 syndesmophytes that had developed after 5 years (n=35; 57.4%) showed no changes on the baseline MRI. There were no significant differences in the development of new syndesmophytes between the three different spinal segments. The detailed analysis of the development of syndesmophytes from different MRI lesions is shown in table 2.
Detailed explanation of the course of MRI lesions and the numbers and RR for the new developed syndesmophytes after 5 years
Prospective analysis of VEs with MRI changes at baseline
Out of 958 VEs (65.3%) that showed no MRI changes at baseline, 35 VEs (3.6%) developed new syndesmophytes after 5 years (table 2). Development of fat after 2 years was seen in 109/958 of these VEs (11.4%) and subsequently 9 of these developed syndesmophytes (8.3%) at year 5. The relative risk for syndesmophyte development for these VEs was 3.2 (95% CI 1.1 to 9.2, p=0.028) after 2 years and 2.4 (95% CI 1.1 to 5.2, p=0.024) after 5 years (table 2, figure 2).
From the VEs that showed MRI lesions at baseline, 160 VEs (10.9% of all VEs) showed inflammation without FD, but only 4 of them (2.5%) developed a syndesmophyte at year 5. In comparison, 235 VEs (16.0%) showed FD without inflammatory changes on MRI at baseline, but only 12 of these (5.1%) developed a syndesmophyte at year 5. Of interest, in either finding, association with syndesmophyte development was only seen either if no lesion or if FD was recorded at year 2 (table 2, figure 2). The relative risk for development of syndesmophytes in VEs with either inflammation or fatty change was not significantly increased (table 2, figure 2).
In contrast, out of 113 VEs (7.7%) that showed a combination of inflammatory and fatty degenerative changes on MRI at baseline, 10 VEs (8.8%) developed a syndesmophyte at year 5 of the study. Notably, none of these showed inflammation at year 2, but all had FD at year 2 (table 2). For these changes, the relative risk for syndesmophyte development was 5.0 (95% CI 1.8 to 14.2, p=0.002) after 2 years and 3.3 (95% CI 1.3 to 8.1, p=0.009) after 5 years (table 2, figure 2).
Analyses on a per-patient basis
At baseline, the occurrence of at least one syndesmophyte was recorded in 51/73 patients (70%). Overall, more syndesmophytes were developed in these patients as compared with those without syndesmophytes at baseline: the 35 new syndesmophytes at year 2 were observed in 27 patients, and 22 of these (81.5%) already had syndesmophytes at baseline versus 5/27 (18.5%) without syndesmophytes at baseline (p<0.001). Similarly, 61 new syndesmophytes at year 5 were observed in 35 patients, 28 of which (80%) already had syndesmophytes at baseline versus 7/35 patients (20%) without syndesmophytes at baseline (p<0.001).
Discussion
This study provides some evidence that changes that can be detected by MRI have predictive potential for new bone formation in patients with AS. We show that for the prediction of growth of syndesmophytes, fatty changes are more important than inflammation and that the combination of inflammatory and fatty changes is the strongest predictor of future bone formation. Since in the majority of cases no MRI changes were seen at baseline, some open questions remain, including the sensitivity of MRI.
The images used for this study were collected as part of EASIC—a European investigator-driven cohort with many participating centres taking care of patients with AS who underwent continuous anti-TNF therapy with infliximab over 5 years. This needs to be stressed because this means that our data do not represent the natural course of the disease. Such data are currently not available—in the Outcome in Ankylosing Spondylitis International Study (OASIS)26 and the German Spondyloarthropathy Inception Cohort (GESPIC)27 cohorts only radiographs were taken, and the evaluation of the Devenir des Spondylarthropathies Indifférenciées Récentes (DESIR) cohort28 has just started. On this background, we were able to study the relation and association of pathologic changes as detected by MRI and CRs at two and three different time points, respectively. Thus, EASIC is currently the longest follow-up study on that subject that has been performed to date. Since the data were collected at different European centres, any bias due to inclusion of patients from only one centre has been avoided. We think that the success of EASIC demonstrates the potential and the importance of international collaboration to provide data on large cohorts.
The results of this study are of special interest in relation to the ongoing discussion on effects of anti-TNF therapy on disease progression as assessed radiographically18 ,19 ,29; this therapy is internationally recommended as second-line treatment for patients diagnosed with AS who show high disease activity despite conventional treatment with NSAIDs.4
In order to evaluate all changes that can be currently depicted by MRI, including both STIR sequences to detect more acute inflammatory changes and T1 sequences to detect more chronic structural changes, it was decided to modify the recent proposal by Maksymowych et al20 who differentiated between acute (‘type-A’) and mature (‘type-B’) spinal MRI changes. Based on our experience, we propose to differentiate to all possible types of spinal MRI findings as explained in the Methods section (see also figure 1).
Overall, the majority of syndesmophytes that developed within 2 and 5 years were not preceded by lesions that were detected by MRI. This finding clearly raises questions on the sensitivity of MRI. Indeed, recent histological studies30 ,31 have demonstrated inflammation in regions without indicative MRI signals. However, more data will be needed to shed light on this important issue.
Most of the syndesmophytes that developed over time in this study were found in patients who had prevalent syndesmophytes when anti-TNF therapy was initiated—this confirms reports from other studies.3 ,22 These findings may suggest that new bone formation in one region may exert a general influence. On the other hand, with respect to MRI edges that had prevalent pathologic lesions, we found that the highest risk for the development of syndesmophytes was found in VEs in which both inflammation and FD had been detected at baseline. Furthermore, the presence and development of fatty changes at baseline and 2 years appeared to be a critical event since, importantly, the disappearance of inflammation after 2 years mattered only in terms of new bone formation when fatty changes remained. This finding indicates that in patients with axSpA, not only the regression of osteitis should be a major target but also the prevention of fatty changes—a factor that seems to be strongly associated with new bone formation. Furthermore, the array of possible interactions of inflammation and fat needs to be better understood. This includes the question of how long the process of tissue metaplasia remains potentially reversible. Whether other factors related to the pro-osteoblastic potential of anti-TNF therapy18 add to the process of new bone formation is unknown. Vascular endothelial growth factor, which is highly expressed in osteoblastic precursor cells and is known to stimulate bone formation, has recently been identified as a strong predictor of new bone formation18 ,32; expression of this cytokine is reduced by TNF blockers resulting in reduced osteoblast and increased adipocyte differentiation.33 Very much in line with these ideas is our finding that in almost 70% of the VEs with inflammation at baseline, no new lesions, either inflammatory or showing FD, were detected after 2 years.
Finally, the recently proposed sequence of inflammation followed by FD ending in bone formation, which has been attributed, at least partially, to anti-TNF therapy,18 ,20 was rarely observed in this study. Thus, our data argue against the so-called ‘TNF-brake hypothesis,’6 which implies that the chronic presence of inflammation suppresses possible pro-osteoblastic effects on the VE level, whereas in contrast blockade of TNFα may stimulate new bone formation. However, it cannot be excluded that even 5 years may be too short to see this. The observation that all VEs in which there was both inflammation and FD at baseline and in which later syndesmophytes developed, showed FD in between, seems to be suggestive of this sequence, but it explains less than 10% of the whole process as detected by MRI. Furthermore, as also described and discussed in this study, even syndesmophytes themselves may show all these different kinds of MRI changes.
The decreasing risk for the development of new syndesmophytes in patients on anti-TNF therapy over 5 years seen in this study is in line with recent data of our group.34 Whether anti-TNF treatment has a more beneficial effect on bone formation in early (characterised by inflammation) rather than late (characterised by fat metaplasia) stages of the disease remains to be elucidated, but seems possible. Recent clinical data have shown that young patients diagnosed early have most clinical benefit from such therapy.35
It is noteworthy that our results are also the first to describe MRI findings in VEs where syndesmophytes are already detectable on radiographs. The majority of these VEs (56%) showed FD on MRI, and in 20% inflammation was visible, while in about a third of syndesmophytes no lesions were detected on MRI. In only 12% of syndesmophytes both inflammation and FD occurred. These findings suggest that the growth of syndesmophytes is a dynamic process that develops over long periods of time in different stages.
Finally, we found a proportionally slightly higher syndesmophyte development in the small part of the thoracic spine that was included in this study as compared with the cervical and the lumbar spine. However, this was only a trend and the comparison was not statistically significant. Overall, the number of VEs evaluated here can be considered small in order to draw further conclusions on the debate on whether the inclusion of the lower part of the thoracic spine adds important information in the assessment of new bone formation in patients with AS36 or not.37
There are some limitations of this study. First, all patients were treated with TNF blockers. Thus, we do not have data on patients’ natural course of disease. Second, the relatively limited population can also be considered as a limitation, also on the background of the low incidence of new syndesmophytes during the 5 years of the study. Nevertheless, and since the analysis of the data was performed not only on the basis of patients but mainly on the basis of single VEs and also since the follow-up examinations included two different time points, we believe that this limitation has a rather minor role in the interpretation of the results. Third, most patients had elevated CRP levels at baseline, which may make a generalisability of the results difficult. In addition, we do not have information on the possible role of NSAID intake and of smoking on radiographic progression in this study despite the fact that these factors have a documented influence on radiographic progression.38 Furthermore, and because of the known technical problems in assessment of the thoracic spine in standard X-rays3 this part of the spine was not available for analysis. To answer this question, studies including examinations with CT of the entire spine are necessary, but these studies are difficult to perform due to ethical reasons occurring from the increased radiation exposure of the patients. Finally, it needs to be taken into account that there might have been MRI findings that have occurred between the time points of MRI examinations performed in this study, which can have influenced any kind of further changes, including new bone formation. Since the study protocol did not include MRI examinations on a regular basis (eg, every 4 weeks or every 6 months, etc), we cannot make any conclusions on this from the present data set. A long-term study with MRI performed on a regular basis with even shorter intervals than 6 months between examinations would be able to show the course of such lesions in more detail.
In conclusion, in this study of AS patients under long-term anti-TNF treatment, we confirm that new bone formation does occur in these patients in the cervical and the lumbar spine. However, the regression of inflammation was not predictive of new bone formation and there was a tendency for the number of syndesmophytes to decrease over time—these findings argue against a major role for the TNF-brake hypothesis. This new bone formation risk is linked to both inflammation and FD evidence, which can be assessed by MRI prior to treatment initiation. Notably the combination of both these pathologic changes was associated with a significantly elevated risk for new bone formation. How the interaction of fat and bone tissue works in detail remains to be elucidated. Importantly, in the vast majority of cases new syndesmophytes were not preceded by any MRI change at baseline—this may be explained by the limited capacity of MRI to visualise pathologic changes. Nevertheless, the regression of inflammation by anti-TNF therapy in patients with axial spondyloarthritis remains an important target of therapy. Whether early treatment can also inhibit new bone formation seems possible, but remains to be shown.
Acknowledgments
We thank the patients of this study for their participation and willingness for the MRI. Furthermore, we thank Beate Buss for her help in the coordination of collecting the MR images.
References
Footnotes
-
Handling editor Tore K Kvien
-
Contributors XB: idea, reading of images, study coordination and writing of manuscript; FH: study coordination, patient recruitment, image recruitment and management of images; JC, JL: statistical analysis; DP: blinding and management of images; JB: idea, writing of manuscript and study coordination; all other authors: patient recruitment, image recruitment and editing of manuscript.
-
Funding No funding was provided for the performance of this imaging substudy. Centocor Inc, The Netherlands, provided funding for the data collection and monitoring of the clinical part of the EASIC study and EASIC registry.
-
Competing interests None.
-
Patient consent Obtained.
-
Ethics approval Local university ethical committee of the European centre that participated.
-
Provenance and peer review Not commissioned; externally peer reviewed.