Article Text

Abstract
Objectives To describe trends in the epidemiology of gout and patterns of urate-lowering treatment (ULT) in the UK general population from 1997 to 2012.
Methods We used the Clinical Practice Research Datalink to estimate the prevalence and incidence of gout for each calendar year from 1997 to 2012. We also investigated the pattern of gout management for both prevalent and incident gout patients.
Results In 2012, the prevalence of gout was 2.49% (95% CI 2.48% to 2.51%) and the incidence was 1.77 (95% CI 1.73 to 1.81) per 1000 person-years. Prevalence and incidence both were significantly higher in 2012 than in 1997, with a 63.9% increase in prevalence and 29.6% increase in incidence over this period. Regions with highest prevalence and incidence were the North East and Wales. Among prevalent gout patients in 2012, only 48.48% (95% CI 48.08% to 48.89%) were being consulted specifically for gout or treated with ULT and of these 37.63% (95% CI 37.28% to 38.99%) received ULT. In addition, only 18.6% (95% CI 17.6% to 19.6%) of incident gout patients received ULT within 6 months and 27.3% (95% CI 26.1% to 28.5%) within 12 months of diagnosis. The management of prevalent and incident gout patients remained essentially the same during the study period, although the percentage of adherent patients improved from 28.28% (95% CI 27.33% to 29.26%) in 1997 to 39.66% (95% CI 39.11% to 40.22%) in 2012.
Conclusions In recent years, both the prevalence and incidence of gout have increased significantly in the UK. Suboptimal use of ULT has not changed between 1997 and 2012. Patient adherence has improved during the study period, but it remains poor.
This is an Open Access article distributed in accordance with the Creative Commons Attribution Non Commercial (CC BY-NC 3.0) license, which permits others to distribute, remix, adapt, build upon this work non-commercially, and license their derivative works on different terms, provided the original work is properly cited and the use is non-commercial. See: http://creativecommons.org/licenses/by-nc/3.0/
Statistics from Altmetric.com
Introduction
Gout is the most common inflammatory arthritis with a diverse spectrum of clinical manifestations. In addition to recurrent acute arthritis, subcutaneous tophi and chronic painful arthritis,1 it also has an impact on morbidity2–,4 and premature mortality.5–,7 Gout results from the deposition of monosodium urate (MSU) crystals in peripheral joints and soft issues due to persistent elevation of uric acid levels above the saturation point for crystal deposition. Effective urate-lowering treatment (ULT) that maintains uric acid below this critical level will prevent further MSU crystal formation and dissolve away existing crystals,8 making gout the only chronic arthritis that can be ‘cured’. However, studies show that only a minority of gout patients receive effective treatment, the majority continuing to experience recurrent acute attacks, further joint damage and other complications.9–,12
In the UK, several studies have estimated the prevalence of gout since the 1970s.13–,20 Two of these both report a prevalence of 1.4% onward from 199918 to 200519 suggesting a plateau of prevalence, whereas three studies using different population-based databases have reported a rise in the incidence of gout in the past decade.18 ,20 ,21 In addition, only approximately a quarter of gout patients in the UK receive ULT within 1 year from diagnosis,21 which should contribute substantially to the elevated prevalence.
Currently, UK data from the current millennium exploring gout incidence and prevalence, assessed at multiple time points in the same population, are sparse. Therefore, we undertook this study to examine the prevalence and incidence of gout and patterns of gout management using the Clinical Practice Research Datalink (CPRD) from 1997 to 2012.
Methods
Source of data
The CPRD is one of the largest databases of longitudinal medical records from primary care in the world. Established in 1987 and named the General Practice Research Database (GPRD) until April 2012, the CPRD has collected anonymised clinical records from around 12 million individuals, representing 8% of the UK population, with demonstrated reliable research standard data. A recent systematic review supported a high validity of recorded diagnoses in CPRD, with a median proportion of cases with a confirmed diagnosis of 89% for 183 different conditions.22
Study population
Our study comprised all participants who contributed data to the CPRD between 1 January 1997 and 31 December 2012. The denominator for prevalence estimation (eligible population) for each calendar year included all individuals registered on 1 July of each calendar year with the general practices which were up-to-standard for CPRD research. For incidence of gout, we constructed at-risk cohorts for each calendar year which comprised all individuals registered with up-to-standard practices during the year specified who had no history of gout diagnosis before the latest of current registration date plus 365 days or 1 January of the calendar year specified. Person-years of follow-up were then calculated from the latest of 1 January or the date of registration plus 365 days to the earliest date of transfer-out, incident gout diagnosis, death or 31 December of the specified year.
Case definition of gout
Prevalent cases of gout were defined as participants who had gout on 1 July of each calendar year, whereas incident cases of gout were those who had no gout prior to the latest of current registration date plus 365 days or 1 January of each calendar year but developed gout during the year. To be eligible as an incident case, participants had to have at least 1-year registration prior to the first date of gout diagnosis.21 Gout was defined as according to READ coding. Since some READ codes apparently indicate prevalent gout (such as history of gout), we only used 18 codes for incident gout identification but there were 39 codes for prevalent gout identification (see online supplementary table S1). The case definition has been validated in a previous study.23 Meier and Jick reviewed medical records and laboratory results of 10 confirmed (with recorded diagnosis, elevated serum urate and drug treatment) and 28 probable (with recorded diagnoses and drug treatment) gout patients and ascertained 10 out of 10 confirmed cases and 24 out of 28 probable cases to be true gout patients (overall positive predictive value 90%).
Estimation of prevalence and incidence
Prevalence was calculated using the number of people diagnosed with gout at any time before the midpoint of a calendar year as the numerator and the number of all individuals contributing CPRD data at the same time point as the denominator. Incidence was calculated using the number of incident gout cases during a calendar year as the numerator and the total person-years occurring during the same year as the denominator.
Prevalence and incidence were calculated for 13 regions in the UK: North East, North West, Yorkshire and the Humber, East Midlands, West Midlands, East of England, South West, South Central, London, South East Coast, Northern Ireland, Scotland, and Wales. To remove the effect of different age and gender structures in these regions, we standardised prevalence and incidence with the overall population structure using 2012 as the reference. We used choropleth maps to represent geographic variations of gout in the UK.
Pattern of treatment
We studied the proportion of prevalent gout patients who were being consulted specifically for gout or being treated by ULT (allopurinol, febuxostat, benzbromarone, probenecid or sulfinpyrazone) in each calendar year during the period 1997–2012. We also estimated the proportion of incident patients who were treated by ULT within 6 and 12 months of diagnosis.
Adherence to ULT
Adherence to ULT among prevalent gout patients was measured using proportion of days covered (PDC) to represent the degree of prescription-filling in a given interval specified. PDC was calculated as the proportion of days on which a patient had available prescriptions for ULT in each interval, which was defined as the period from the latest of registration date or 1 January to the earliest of transfer-out, death date or 31 December of the calendar year specified. For overlapping prescriptions, the later prescription was assumed to start from the end of the prior prescription; this was to avoid double counting of days covered. We then divided the gout patients into four groups according to status of being treated and adherence at each calendar year: not treated, non-adherent (those with a PDC less than 20%), partially adherent (those with a PDC of 20%–79%) and adherent (those with a PDC of at least 80%). We assessed the management of incident gout patients by the percentage of incident gout patients treated with ULT at 6 months and 1 year after diagnosis.
Trends of prevalence, incidence and management of gout
To determine the trends of prevalence, incidence and management of gout, we calculated age-, sex- and length of data contribution-standardised prevalence, incidence of gout and pattern of ULT in each calendar year from 1997 to 2012 with the population structure in year 2012 as reference. The length of data contribution of each patient was defined as the period from the current date of registration to 1 July of each calendar year for prevalence or to 1 January of the calendar year specified for incidence. The reasons to include length of data contribution to standardise prevalence, incidence and PDC were (1) prevalence, incidence and PDC estimation were subject to length of data contribution with a tendency toward higher prevalence and incidence (see online supplementary figure S1) and (2) the distribution of length of data contribution was different in calendar years studied, with longer length of data contribution in more recent years (see online supplementary figure S2).
Statistical analysis
The 95% CIs for prevalence and incidence were derived on the basis of the assumption of a Poisson distribution of the observed prevalent cases. We used the Joinpoint Regression Program (V.4.0.4) to estimate trends of prevalence and incidence of gout. The program uses Bayesian Information Criterion to generate different numbers of ‘joinpoints’ in time when the trend of prevalence and incidence of gout change significantly and to determine the best-fit data series.24 Initially models contained zero joinpoints (ie, a straight line fitted to the data) with joinpoints added whenever a change in trend over time is statistically significant, with the user specifying the maximum number of allowable joinpoints. Using a Bayesian information criterion approach, we selected a maximum of three joinpoints. Annual percentage changes (APC) for each segment and average APC for the entire study period of prevalence and incidence were calculated. The significance level was set at 0.05. All statistical analyses were performed by using SAS statistical software, V.9.3.
Role of the sponsors
The sponsor of the study, University of Nottingham and Chang Gung Memorial Hospital, had no role in study design, collection, analysis and interpretation of the data and the preparation, review or approval of the paper.
Results
Prevalence and incidence in 2012
Of 4 634 974 eligible individuals in 2012, 115 608 prevalent cases of gout were identified, giving a prevalence of 2.49% (95% CI 2.48% to 2.51%). Men had a significantly higher prevalence of gout (3.97%; 95% CI 3.96% to 4.00%) than women (1.05%; 95% CI 1.04% to 1.06%). This gender difference was observed in all ages with a male to female ratio of 1.5 in individuals younger than 20 years, peaking at 11.2 in those aged 35–39 years bands and then decreasing to 2.5 for those older than 90 years. Gout was rare in people younger than 20 years (5.11 cases per 100 000 individuals) and it increased with age thereafter. In both men and women, the prevalence plateaued after the age of 80 years (figure 1A). In the adult population aged 20 years of more, the prevalence of gout (95% CI) was 3.22% (3.20% to 3.23%), 5.17% (5.14% to 5.20%) in men and 1.34% (1.33% to 1.36%) in women.

Age-specific prevalence (A) and incidence (B) of gout in 2012 (Blue: men; red: women; green: total; dotted lines show 95% confidence bounds).
There were a total of 4 159 043 person-years of follow-up in 2012 during which 7343 incident cases of gout were identified (overall incidence 1.77 (95% CI 1.73 to 1.81) per 1000 person-years). Men had a higher incidence of gout (2.58 (95% CI 2.51 to 2.65) per 1000 person-year) than women (0.99 (95% CI 0.95 to 1.04) per 1000 person-year). As shown in figure 1B, incidence of gout was greatest in people aged 80–84 years in both men and women. The male to female ratio widened from the lowest in individuals younger than 20 years (1.2) to a peak of 15.4 in those aged 30–34 years and thereafter the difference narrowed down. In the adult population, the incidence of gout (95% CI) was 2.26 (2.21 to 2.31) per 1000 person-years, 3.50 (3.26 to 3.44) per 1000 person-years in men and 1.25 (1.20 to 1.31) per 1000 person-years in women.
Prevalence and incidence of gout between 1997 and 2012
Table 1 shows the temporal trends in prevalence and incidence of gout from 1997 to 2012. In general, both crude and standardised estimates increased over time during this period. The standardised estimates were slightly higher than the crude ones, accounting for the fact that the average length of data contribution was higher in 2012 than 1997.
Crude and standardised prevalence and incidence of gout from 1997 to 2012
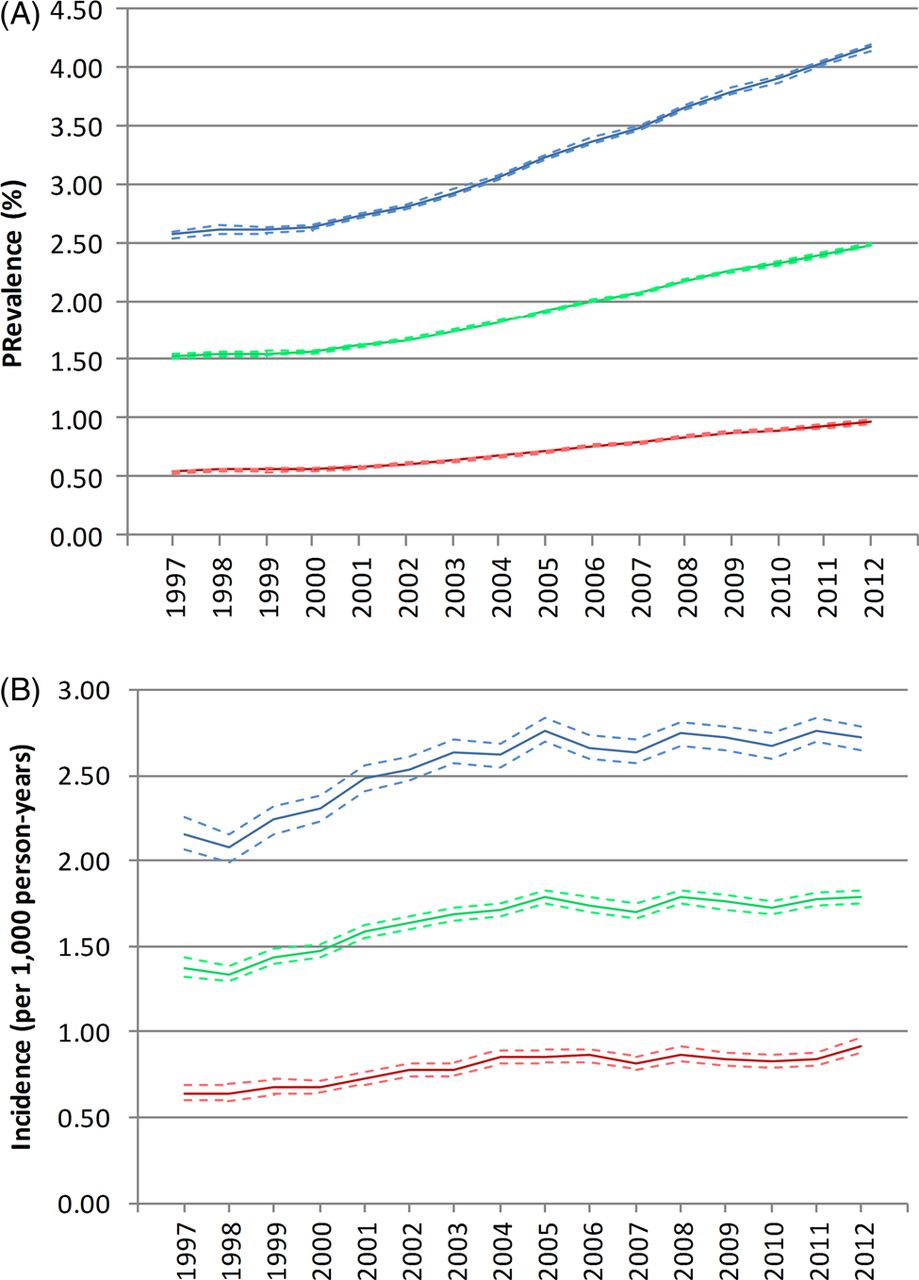
The standardised prevalence of gout increased 63.9% over the study period. On average, the standardised prevalence increased 4.2% (95% CI 3.9% to 4.5%) per year, suggesting the prevalence of gout in UK was increasing over the study period. Furthermore, there were two joinpoints at 2000 and 2008 with respective APCs of 1.3 (0.5 to 2.1), 4.6 (4.3 to 4.9) and 3.3 (2.8 to 3.8) for segment 1997–2000, 2000–2008 and 2008–2012, respectively. As figure 2A shows, the temporal trend of prevalence in men and women was not parallel (p<0.001). On average, prevalence in women increased 4.6% (95% CI 4.3% to 5.0%) and was slightly higher than in men (4.1% (95% CI 3.7% to 4.4%)). However, the male to female ratio was only slightly narrowed from 4.8-fold in 1997 to 4.3-fold in 2012.

Gender differences in the trends of standardised prevalence (A) and incidence (B) of gout between 1997 and 2012 (blue: men; red: women; green: overall; dotted line: 95% confidence bounds).
The standardised incidence also increased significantly (29.6%) during the study. On average, the incidence of gout increased 1.5% (95% CI 1.1% to 1.9%) per year and there was only one joinpoint (2003). The annual change of incidence increased 3.8% (95% CI 2.7% to 4.9%) per year during the period between 1997 and 2003 but the incidence reached a plateau afterwards, with an annual change of 0.2 (95% CI −0.4 to 0.9; p=0.45). Figure 2B shows a very similar trend of gout incidence in men and women (p=0.171), albeit a slightly higher average annual change in women (2.0%, 95% CI 1.3% to 2.7%) than in men (1.5%, 95% CI 0.9% to 2.0%). The male to female ratio in incidence slightly reduced from 3.4 in 1997 to 3.0 in 2012.
Geographic variation in 2012
Both prevalence and incidence of gout were not uniform throughout the UK. As shown in figure 3, the standardised prevalence (95% CI) of gout was highest in the North East (3.11% (3.00% to 3.23%)) and Wales (2.98% (2.93 to 3.02)). Regions with the lowest prevalence of gout were Scotland (2.02% (1.98% to 2.06%)) and Northern Ireland (2.15% (2.07 to 2.22)). The East of England and Northern Ireland were the regions with the lowest standardised incidence (95% CI) of gout (1.50 (1.37 to 1.65) and 1.57 (1.45 to 1.69) per 1000 patient-years, respectively), while Wales and the North East had the highest incidence (2.28 (95% CI 2.13 to 2.43) and 2.17 (95% CI 1.85 to 2.54) per 1000 patient-years, respectively).

Geographic variations in the prevalence (A) and incidence (B) of gout in the UK in 2012.
Management of gout between 1997 and 2012
Among prevalent gout patients in 2012, approximately half were being consulted specifically for gout or being treated with ULT (48.48%; 95% CI 48.08% to 48.89%) and only a third were being treated with ULT (37.63%, 95% CI 37.28% to 38.99%). As shown in figure 4A, the percentage of patients being consulted for gout or treated with ULT remained poor and almost constant during the study period, with an APC (95% CI) of −0.3% (−0.4% to −0.2%). Similarly, the percentage of patients being treated with ULT has not changed, with an APC of −0.1% (−0.2% to 0.1%).
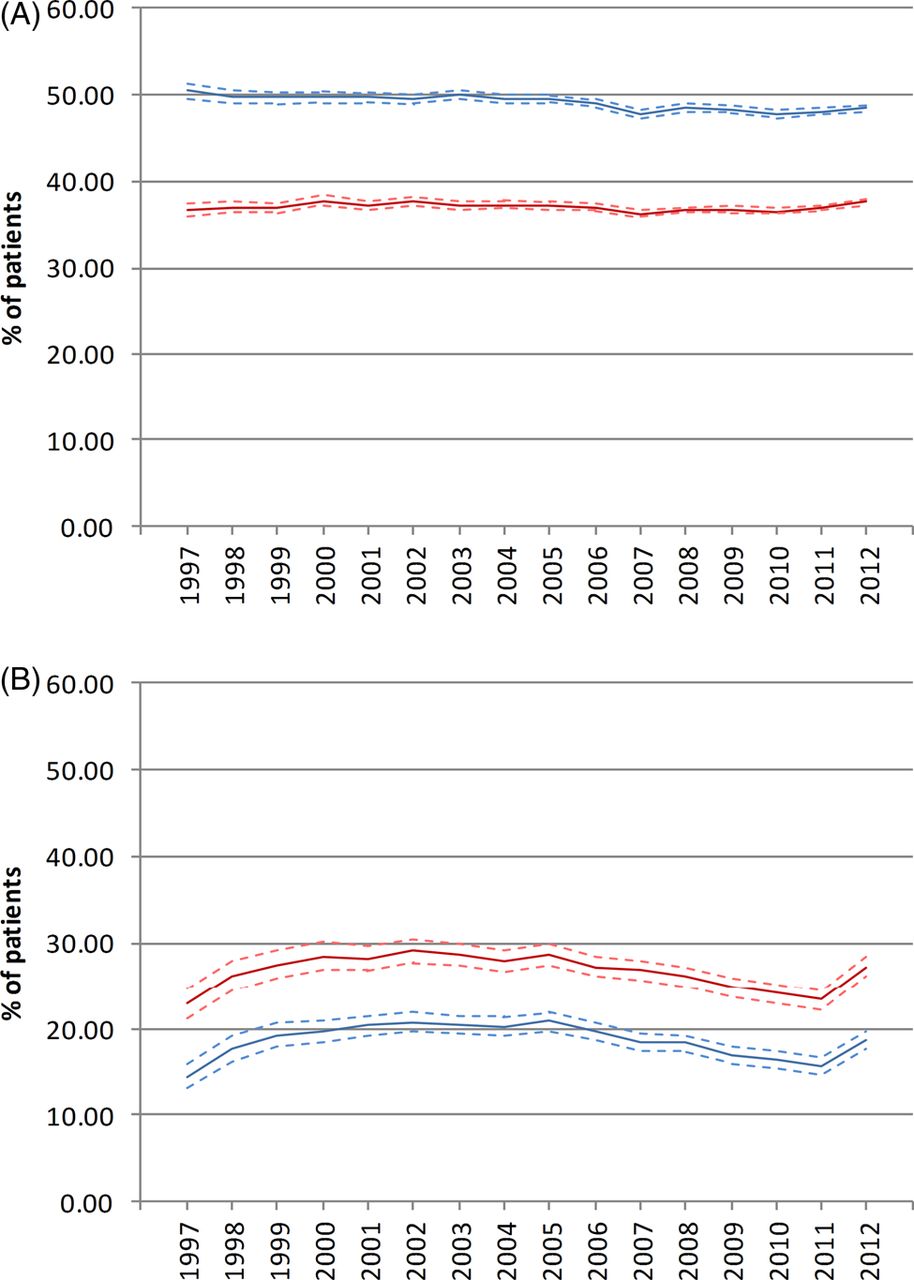
Management of gout (A) standardised percentage of prevalent patients being consulted for gout or treated with ULT (blue line), and treated with urate-lowering agents (red line) and (B) standardised percentage of incident patients receiving urate-lowering treatment at 6 months (red line) and 12 months (blue line).
In 2012, only 18.6% (95% CI 17.6% to 19.6%) of incident gout patients received ULT within 6 months and approximately one in four were treated within 12 months of diagnosis (27.3%; 95% CI 26.1% to 28.5%). As figure 4B shows, the percentage of patients receiving ULT within 6 and 12 months changed only marginally during the study period with APCs (95% CI) of −1.0% (−2.1% to 0.2%; p=0.100) and −0.8 (−1.6 to 0.1; p=0.07), suggesting that the management of incident gout patients has remained essentially the same over the past 16 years.
Adherence to ULT
Among ULT treated patients in 2012 (n=49 395), 39.66% (95% CI 39.11% to 40.22%) were adherent to treatment. Partially adherent and non-adherent patients comprised 42.84% (95% CI 42.27% to 43.42%) and 17.50 (95% CI 17.13% to 17.87%), respectively. In contrast to the percentage of patients receiving ULT, patient adherence to ULT improved in the past 16 years (figure 5). Overall, the percentage of adherent patients improved from 28.28% (95% CI 27.33% to 29.26%) in 1997 to 39.66% (95% CI 39.11% to 40.22%) in 2012. The average APC was 2.0 (95% CI 1.5 to 2.5). Joinpoints were attributed to 2002 and 2008, with APCs (95% CIs) of 4.5 (2.6 to 6.4) for 1997–2002, 2.2 (1.0 to 3.4) for 2002–2008 and 0.0 (−1.3 to 1.4) for 2008–2012. In contrast, the percentage of partially adherent and non-adherent patients reduced 13.0% and 22.0%, respectively.

Secular trends of adherence of urate-lowering treatment (ULT) treated patients (blue: adherent; red: partially adherent; green: non-adherent patients).
Discussion
This study demonstrates that the burden of gout in the UK is higher than previously thought, with approximately 1 in 40 adults being affected. Furthermore, the prevalence of gout has continued to increase from 1997 to 2012 despite a stabilised incidence after 2005. Gout is not distributed uniformly within the UK, the highest prevalence and incidence of gout being in the North East and Wales. Unfortunately, despite this rising prevalence and the publication of European25 and UK26 guidelines in 2006 and 2007, respectively, the management of gout appears to be more than suboptimal with only one in three prevalent patients receiving ULT and only one in four newly diagnosed patients received ULT within 1 year of diagnosis. Although patient adherence to ULT has improved in the past decade this still remains poor.
Early studies showed an increase in gout prevalence in the UK up until 1999, when a nationwide study by Mikuls et al18 using the GPRD reported an overall prevalence of 1.39%. Using the IMD analyser in the period 2000–2005, Annemans et al19 reported an identical prevalence of 1.4% suggesting that gout prevalence may have reached a plateau. In contrast, our prevalence estimates were slightly higher during the period 1999–2005 and continued to increase throughout the study period. We consider this disparity to primarily result from different degrees of identification of clinically silent patients, whose identification depends on a period of data contribution that is long enough to include a prior gout event. However, it is difficult to determine how many years of observation are sufficient to exclude this bias since data on length of asymptomatic inter-critical gout period are sparse. Only one case series in 1961 reported that the length of inter-critical periods was less than 1 year in 62%, 1–5 years in 27%, 6–10 years in 4% and over 10 years in 7% of 614 patients.27 Therefore, we did not set a minimal length of data contribution but instead used direct standardisation considering age, sex and length of data contribution to circumvent the incomplete identification of inter-critical gout patients. Therefore, studies that have not examined prior data contribution will have underestimated the prevalence of gout in the UK. When this bias is avoided, it is apparent that the standardised prevalence of gout has risen since 1997. In addition, the prevalence of gout in the UK is higher than recent estimates in other European countries, specifically 1.4% in Germany19 and 0.91% in Italy.28
Very few studies have addressed the incidence of gout. Using data from the UK Second and Third National Studies of Morbidity in General Practice in the UK, overall gout incidence was estimated to be 1.4/1000 person-years in 1981.29 Incidence estimates based on the GPRD ranged from 1.19 to 1.80/1000 person-years in the period 1990–199918 and those based on the Royal College of General Practitioners Weekly Returns Service ranged from 1.12 to 1.35/1000 population between 1994 and 2007. Another study using the THIN database reported an incidence of 2.68/1000 person-years in the adult population in the period 2000–2007.20 Our estimates of incidence in general fall within these previous reported ranges. However, we found that the incidence of gout has increased by more than a quarter during the study period. Although it reached a plateau after 2004, it has shown no signs of subsequent reduction, a finding echoed by our observations of an increasing prevalence. Therefore, gout will remain a commonly encountered disorder and the prevalence may even continue to rise in the near future.
In addition to temporal changes we also documented clear evidence for regional variations in gout. The patterns for prevalence and incidence were similar, with the North East and Wales having the highest estimates for both. Regional variation within the UK has been noted previously in just two studies. In a survey in 1975, Currie et al14 reported a higher prevalence of gout in England than in Wales and in 1982 Gardner et al15 reported a lower prevalence (3.9%) in adults over age 45 in Ipswich in Suffolk than in the two more northern towns of Wakefield (4.5%) and Preston (4.9%). To the best of our knowledge, there are no previous reports of geographical variation in incidence of gout in the UK. The reasons for current geographic variation in gout most likely relate to differences in socioeconomic status, life-style and nutrition and although gout historically was considered a disease of affluence, the converse may now be true. The UK morbidity statistics from general practice (1970–1971) reported that people with non-manual skilled occupations had the highest whereas professional occupations had the lowest standardised consulting ratio for gout (133 vs 79)30 and the study of Gardner and colleagues found a lower prevalence of gout in the town with the most favourable socioeconomic status.15 In addition, a recent New Zealand study also found that the least deprived people had the lowest risk of gout.31 However, further studies are needed to explore the reasons for current variation by socioeconomic group and region.
Regardless of the increasing prevalence and incidence of gout in the UK, the management of the disease remains poor. We found that throughout 1997–2012 only around a third of people with prevalent gout were prescribed ULT. The management for incident gout patients also remained unchanged with only a quarter to a third of patients being treated with ULT within 1 year of diagnosis. This shows no significant change in overall usage of ULT from the estimates of Mikuls et al of 25.3%–29.5% from 1990 to 1999.18 Apart from underprescribing of ULT, Mikuls et al10 identified inappropriate prescribing of ULT in a quarter to a half of those people in whom quality indicators could be assessed and a more recent study also demonstrated suboptimal care in many aspects of gout management.32 Collectively, these results reflect widespread lack of knowledge of gout and poor alignment with current recommendations of best practice within the UK.33–,35 Although guidelines do not explicitly advise discussion of ULT with every gout patient around the time of diagnosis, the majority of patients will have recommended specific indications (eg, further attacks,27 renal impairment,36 required chronic diuretic use,36 nephrolithiasis,37 peripheral joint damage or tophi38) at diagnosis or within 6–12 months. Furthermore, increasingly the trend is towards early treatment with ULT to prevent people developing further crystal deposition and complications such as subcutaneous tophi and joint damage.35 Best practice requires full patient information concerning gout and its treatment25 ,26 ,35 and in one recent UK study, when patients received this 100% wished to receive ULT.34 ,35 Being that gout is the only chronic arthritis for which there is ‘curative’ treatment, the use of ULT would seem a useful indicator of standard of care.35
We also found that only approximately 40% of treated patients in 2012 adhered to ULT. This accords with a recent review of six studies which reported that only 18%–44% of patients with gout adhere to ULT.39 Such poor adherence to ULT has long been recognised, one review finding adherence in gout patients to be the worst of seven chronic diseases requiring chronic medication.40 Nevertheless, we did find an encouraging signal of a 40% improvement in percentage of adherent patients from 1997 to 2012. Although previous studies largely blame patients for poor adherence,39 ,41 a recent study indicated that appropriate patient education can effectively maintain high adherence to ULT and achieve therapeutic target in nine out of 10 gout patients.34 Therefore, as with low rates of ULT prescription, it is likely that the fault lies more with the health practitioners than with the patients.35 There are many recognised barriers to care of gout, both in patients and practitioners, but practitioner education seems the first prerequisite to address these problems.
There are several limitations to the study. First, we based our case definition on diagnosis by the general practitioners, rather than according to American College of Rheumatology42 or Rome43 classification criteria or to the ‘gold standard’ of urate crystal identification and this may lead to misclassification bias. However, the validity of gout diagnosis in the CPRD has been investigated and found to be high.23 Second, we based our adherence estimation on PDC, which is generally believed to be more conservative than the more commonly used measure of medication possession ratio. We assumed patients took all the prescribed pills since calculation of PDC relies on records of prescription refills, but this assumption may not hold true and may have led to an overestimation of adherence.
In conclusion, both the prevalence and incidence of gout have risen in the past 16 years and are the highest reported within Europe. However, despite being the commonest inflammatory arthritis the suboptimal management of gout continues unchanged, with only a minority of patients receiving ULT and new patients not being treated in a timely fashion. Although somewhat improved patient adherence to ULT remains poor. It is apparent that educational initiatives to improve practitioner knowledge, interest and standard of care of the only ‘curable’ form of inflammatory arthritis are urgently required.
Acknowledgments
We would like to thank the University of Nottingham and Chang Gung Memorial Hospital for financially supporting this research.
References
Supplementary materials
Supplementary Data
This web only file has been produced by the BMJ Publishing Group from an electronic file supplied by the author(s) and has not been edited for content.
Files in this Data Supplement:
- Data supplement 1 - Online supplement
Press release
Press release
Files in this Data Supplement:
Footnotes
Handling editor Tore K Kvien
WZ and MD are joint senior authors
-
Contributors C-FK and WZ had full access to all of the data in the study and take responsibility for the integrity of the data and the accuracy of the data analysis. C-FK, WZ and MD conceived and designed the study. C-FK and WZ acquired the data. C-FK, MJG, and WZ performed and supervised the statistical analysis. C-FK, MJG, CM, WZ and MD analysed and interpreted the data. C-FK and WZ drafted the manuscript. All authors contributed to the critical revision of the manuscript for important intellectual content. WZ, MJG and MD supervised the study.
-
Funding University of Nottingham and Chang Gung Memorial Hospital.
-
Competing interests None.
-
Ethics approval The study was approved by the Trent Multi-centre Research Ethics Committee (reference number: 05/MRE04/87) and the Independent Scientific Advisory Committee (11-021R).
-
Provenance and peer review Not commissioned; externally peer reviewed.
-
Data sharing statement Additional data and statistical codes are available on request from the corresponding author (weiya.zhang@nottingham.ac.uk).