Article Text

Abstract
Objective Lumbar disc degeneration (LDD) is an important cause of low back pain, which is a common and costly problem. LDD is characterised by disc space narrowing and osteophyte growth at the circumference of the disc. To date, the agnostic search of the genome by genome-wide association (GWA) to identify common variants associated with LDD has not been fruitful. This study is the first GWA meta-analysis of LDD.
Methods We have developed a continuous trait based on disc space narrowing and osteophytes growth which is measurable on all forms of imaging (plain radiograph, CT scan and MRI) and performed a meta-analysis of five cohorts of Northern European extraction each having GWA data imputed to HapMap V.2.
Results This study of 4600 individuals identified four single nucleotide polymorphisms with p<5×10⁻⁸, the threshold set for genome-wide significance. We identified a variant in the PARK2 gene (p=2.8×10⁻⁸) associated with LDD. Differential methylation at one CpG island of the PARK2 promoter was observed in a small subset of subjects (β=8.74×10⁻⁴, p=0.006).
Conclusions LDD accounts for a considerable proportion of low back pain and the pathogenesis of LDD is poorly understood. This work provides evidence of association of the PARK2 gene and suggests that methylation of the PARK2 promoter may influence degeneration of the intervertebral disc. This gene has not previously been considered a candidate in LDD and further functional work is needed on this hitherto unsuspected pathway.
- Gene Polymorphism
- Low Back Pain
- Magnetic Resonance Imaging
This is an open-access article distributed under the terms of the Creative Commons Attribution Non-commercial License, which permits use, distribution, and reproduction in any medium, provided the original work is properly cited, the use is non commercial and is otherwise in compliance with the license. See: http://creativecommons.org/licenses/by-nc/3.0/ and http://creativecommons.org/licenses/by-nc/3.0/legalcode
Statistics from Altmetric.com
Introduction
Lumbar disc degeneration (LDD) is a common, age-related trait:1 over a third of middle aged women have at least one degenerate disc. LDD contributes to low back pain2 ,3 and as low back pain is common in the general population and costly to society,4 LDD is of considerable public health importance. Discrete biochemical, histological, metabolic and functional changes occur in LDD, such that discs become dehydrated, lose disc height and there is accompanying outgrowth of osteophytes from the vertebral body margin.5 There are similarities with peripheral joint osteoarthritis (OA). LDD has been shown to be heritable, with estimates of 65%–80%6 ,7 and so a considerable proportion of the variance in LDD is explained by genetic factors. Yet to date, candidate gene studies have detected only a small number of convincing associations of genetic variants with LDD (reviewed by Ryder et al8). A number of studies show conflicting results: these are likely due to small sample size or may reflect ethnic differences between Northern European and Asian populations, as seen in OA.9 That some published genome-wide associations (GWAs) in common complex traits fail to replicate candidate gene findings suggests limitations to the candidate gene method.10 As in other common complex traits,11 a considerable proportion of the genetic variance in LDD remains unexplained. While GWA studies do not capture all variation in the genome, the approach does offer an agnostic search of the genome for variants associated with common complex traits. Their main limitation results from the inherent multiple testing in their design, meaning that power is lost and large samples are needed to address this. In order to optimise sample size in the present study we performed meta-analysis of GWAS using a number of cohorts having the LDD phenotype.
Patients and methods
The cohorts available for inclusion in this study were all population samples, except Genetics of osteoARthrosis and Progression study (GARP) which specifically recruited participants having a diagnosis of OA. A variable was derived from measures of disc height and osteophytes obtained from lateral images on MR, CT scan or plain radiograph. Summing this variable over the lumbar discs provided a continuous measure of disc degeneration. GWA of this summary variable was performed by each individual study group and summary statistics were sent to and collated by KCL. Meta-analysis was performed of imputed GWA data from five population cohorts (Framingham, GARP, Rotterdam study 1 and 3 and TwinsUK (TUK)) having imaging of the spine (see below). All cohorts had obtained fully informed consent from their participants and appropriate ethics committee approval. In all studies, a cumulative degeneration score was constructed from the sum of scores of degenerative change at each level (disc space narrowing coded 0–3 and osteophytes, either anterior or posterior or both, coded 0–3). In those cohorts where only four disc levels were read (Framingham Heart study (FHS)), a fifth level was imputed by taking the mean reading for four discs as a surrogate for the fifth disc, and summing over five discs. The data underwent inverse normal transformation to generate a normally distributed variable.
Phenotyping the cohorts
The FHS is a longitudinal cohort of a defined population in Massachusetts, initiated in 1948 (http://www.framinghamheartstudy.org). It began as a study sample of 5209 Framingham men and women between the ages of 30 and 60. Subsequently, offspring and third generation subjects were incorporated. Every other year, after an extensive baseline examination, subjects undergo testing that includes a medical history, blood profile, echocardiogram, and bone, eye and other tests. The subset of the Framingham subjects covered by the current analysis comprised 366 subjects from the Offspring and Generation three arms of the study who had undergone CT scanning of the spine, and the recruitment, conduct and specifications of CT scanning have been reported elsewhere.12 Measurement of the lumbar spine CTs for disc height and scoring (0–3) for anterior and posterior osteophytes was performed by a spine specialist using the mid-sagittal plane at spinal levels L2-L3, L3-L4, L4-L5 and L5-S1 by author PS using the atlas of Jarosz et al.7 Using sagittal CT reformatting, the mid-sagittal plane was determined at each spinal level and measurements of disc height in millimetres were made. The measured values for disc height (mm) were converted to 0–3 categorical scale for disc height loss. Using an imputed value for the fifth lumbar disc based on the mean value of the measured four discs, values for disc height loss and anterior and posterior osteophytes were summed over five lumbar disc levels.
The GARP study comprises white sibling pairs of Dutch origin affected by OA at multiple sites and is aimed at identifying determinants of OA susceptibility and progression. Probands (ages 40–70 years) and their siblings had OA at multiple joint sites of the hand or in two or more of the following joint sites: hand, spine (cervical or lumbar), knee or hip as described previously.13 Subjects included in this study had undergone lateral radiographs of the spine (T4-S1). Each intervertebral disc level from L1/2 to L5/S1 was reviewed for the presence and severity of osteophytes (anterior) and disc narrowing, using the Lane atlas14 where 0=none; grade 1=mild; grade 2=moderate; and grade 3=severe. The score at each level for anterior osteophytes and disc height loss were summed over the five lumbar levels.
The Rotterdam study is a prospective population-based follow-up study of the determinants and prognosis of chronic diseases in the elderly.15 ,16 All persons living in Ommoord, a suburb of Rotterdam, who were aged 55 years and over were invited to participate. A total of 7983 participants were examined. For the current analysis, two subsets of the data were considered. Rotterdam cohort 1 (RS1) consists of 2440 subjects; Rotterdam cohort 3 (RS3) consists of 974 subjects. Subjects originating from the Rotterdam study underwent plain radiography and scoring of LDD as previously described.2 In brief, lateral lumbar radiographs were scored by a single observer for the presence of the individual radiographic features of disc degeneration. Each intervertebral disc from L1/2 to L5/S1 was reviewed for the presence and severity of osteophytes (anterior) and disc narrowing using the Lane atlas as described above.14 The scores for the two traits over the five lumbar discs were summed.
The TUK registry was described previously.17 The register was started in 1993 and now comprises of approximately 10 000 monozygotic and dizygotic adult Caucasian twins aged 16–85 years from all over the UK, plus some parents and siblings. It now incorporates previous twin registries from the Institute of Psychiatry and Aberdeen University. This is a volunteer sample recruited by successive media campaigns without selecting for particular diseases or traits. All twins receive a series of detailed disease and environment questionnaires. The majority of twins have been assessed in detail clinically at several time points for several hundred phenotypes related to common diseases or intermediate traits. The subset of TUK covered by the current analysis consisted of 744 subjects who had participated in the spine MR study (scanned 1996–2000) using a Siemens MR machine with (Munich, Germany) 1.0-tesla superconducting magnet. Serial sagittal images of the cervical, thoraco-lumbar junction and lumbar spine (T9-L5) were obtained.7 Images were coded for disc height loss and anterior osteophytes using a 0–3 scale in each case, where 0 is normal and 3 maximal degeneration as per the atlas of Jarosz et al.7 All five lumbar discs were scored and the scores summed to give a combined LDD variable.
Genotyping and imputation
FHS subjects were genotyped using Affymetrix GeneCHip Human Mapping 500 K array set (Affymetrix, Santa Clara, CA, USA) and/or the 100 K array set and/or the 50 K array. Methods and quality controls have been described previously.18
GARP subjects were genotyped using Illumina Human660W Quad BeadChips (HumanHap550v3, HumanHap610; Illumina, San Diego, CA, USA). Genotyping was performed at the genotyping Rotterdam Genotyping Centre. Positive strand genotypes were called by clustering in Genome studio and imputation was performed using IMPUTE software and hapmap phase II V.21.19 ,20 Strict selection criteria were applied to the measured genotypes using a high information content (r2 of >95%) and a minor allele frequency >0.0025. Association analyses were performed using an inhouse developed software package that allows the analyses of family data using all information available in the cases and controls by extending the Cochran-Armitage trend test.21
RSI and RS3 subjects in the Rotterdam Study sets were genotyped on the HumanHap550v3 (RS1) or HumanHap610 (RS3) Genotyping BeadCHip (Illumina, San Diego, California, USA). The following sample quality control criteria were applied: sample call rate >97.5%, gender mismatch with typed X-linked markers, evidence for DNA contamination in the samples using the mean of the autosomal heterozygosity >0.33, exclusion of duplicates or first-degree relatives identified using Identity by State probabilities and exclusion of outliers (four SD away from the population mean using multidimensional scaling analysis with four principal components). Filtering criteria for imputation are summarised in supplementary table S1.
TUK subjects were genotyped using a combination of Illumina arrays (Human Hap300 and the Human Hap610Q). Genotyping was performed by the Wellcome Trust Sanger Institute using the Infinium assay (Illumina) across three genome-wide single nucleotide polymorphism (SNP) sets, as described previously.22 Genotyping results had been sent to KCL for collation and analysis using the statistical package, STATA (StataCorp).23 Strict quality control was applied: 314 075 SNPs were retained for analysis (98.7%); 733 were excluded because their call rates were ≤90% and 725 SNPs had minor allele frequency <0.01. In TUK, significant population substructure was excluded using the STRUCTURE program.24
GWA analysis
All analyses were performed on inverse normal transformed summary LDD score as described above. Each study performed GWA analysis for LDD scores using either MACH2QTL (http://www.sph.umich.edu/csg/abecasis/MACH/index.html) (RS1 and RS3) or SNPTEST (http://www.stats.ox.ac.uk/~marchini/software/gwas/snptest.html) (GARP), which use genotype dosage value as continuous additive predictors of LDD score in a linear regression framework, or ProbABEL25 using an additive genetic model while accounting for relatedness between the members of a family. Analysis of imputed genotype data accounted for uncertainty in each genotype prediction by using either the dosage information from MACH26 or the genotype probabilities from IMPUTE.19
Meta-analysis of the five study groups
Genotypes for 2.5–3 million autosomal SNPs were imputed separately to increase coverage using HapMap V.2 (http://www.hapmap.org) as the reference panel. In GARP and TUK, imputation was performed with IMPUTE V.219 and in the other studies with MACH.26 The common reference panel led to the reporting of results for the positive strand for all cohorts. In addition, allele pairs were compared between cohorts and no detectable strand-flips were found; the minor allele frequency was also compared between datasets. The distributions of β values of the cohorts were found to be similar and therefore suitable for meta-analysis. All directly genotyped or imputed autosomal SNPs having information from more than one study group (n=2 552 511) were included in the meta-analysis. Association results were combined using inverse variance weighted fixed effects meta-analysis using PLINK V.1.06 (http://pngu.mgh.harvard.edu/purcell/plink/). Two meta-analyses were run: the first was unadjusted; the second was adjusted for age and sex as both are known risk factors for LDD and each risk factor was correlated with LDD in each study group. Heterogeneity of estimated effect was expressed using Q (weighted sum of squares) and I2 (ratio of true heterogeneity to total observed variation). SNPs were excluded from the meta-analysis if the cohort-specific imputation quality, as assessed by r2 (MACH) or Information Score (IMPUTE) metric, was <0.40. On this basis, one marker was excluded from the unadjusted association and one from the adjusted association.
DNA methylation data and analysis
Whole blood DNA methylation levels were obtained for 38 individuals in the TUK cohort using the Illumina HumanMethylation27 DNA Analysis BeadChip assay, as previously described.27 The sample included four monozygotic twin pairs, eight dizygotic twin pairs and 14 unrelated individuals. At each CpG site within an individual the methylation level was presented as β, which represents the ratio of intensity signal obtained from the methylated beads in the array over the sum of methylated and unmethylated bead signals. Following quality control checks, we obtained DNA methylation at three CpG sites in the promoter region of the PARK2 gene within 2kb of the transcription start site. The three probes (cg15832436, cg21926612 and cg24816866) mapped uniquely to the human genome (hg18) within two mismatches (see Bell et al28). We fitted linear mixed effects models to assess association between DNA methylation levels at the three CpG sites in the PARK2 promoter and LDD. We regressed the raw methylation levels on fixed-effect terms including methylation chip and LDD, and random-effect terms denoting family structure and zygosity, and compared the association of differentially methylated regions with a null model, which excluded LDD from the fixed-effects terms. We also repeated the association analyses by normalising the methylation values at each CpG site to N(0, 1).
Results
The study samples for the meta-analysis included 4683 individuals of European ancestries. Table 1 shows sample size, demographic characteristics, LDD and lumbar spine imaging method for each independent cohort. The majority of participants were female subjects (67.0%) and the samples had a mean age of 57.7 years. Across the cohorts, the mean level of LDD varied from 0.011 to 3.46, reflecting differences in imaging methods. However, the variance of the LDD variables was broadly similar (range 0.958–1.14), as were the distributions of the estimated genetic effect sizes (β). The genotyping and imputation methods are shown in online supplementary table S1.
Characteristics of the study samples
Quantile–quantile plots for the unadjusted LDD GWA meta-analysis are presented in figure 1 (see online supplementary figure S1, adjusted). Test statistic inflation post meta-analysis, as measured by the genomic control statistic,29 was low (λGC unadjusted=1.02; λGC adjusted=1.03). Results of the unadjusted and adjusted association analyses were broadly similar, with the p values of the adjusted analysis somewhat attenuated. A Manhattan plot for the unadjusted analysis is shown in figure 2 with numeric results in table 2 (unadjusted) and online supplementary table S2 (adjusted) for SNPs having p<10−5.
Results of the genome-wide association meta-analysis (unadjusted, showing those SNPs having p<10−5).

Quantile–quantile plot of observed versus expected distribution of p values for the genome-wide association (GWA) meta-analysis. The plots show GWA meta-analysis quantile–quantile plot of observed against expected results, unadjusted for covariates.

Manhattan plot for meta-analysis of unadjusted genome-wide association results. Plot shows combined results for the five studies included in the meta-analysis, unadjusted results. The blue and red horizontal lines mark the levels of suggestive and likely significance, respectively.
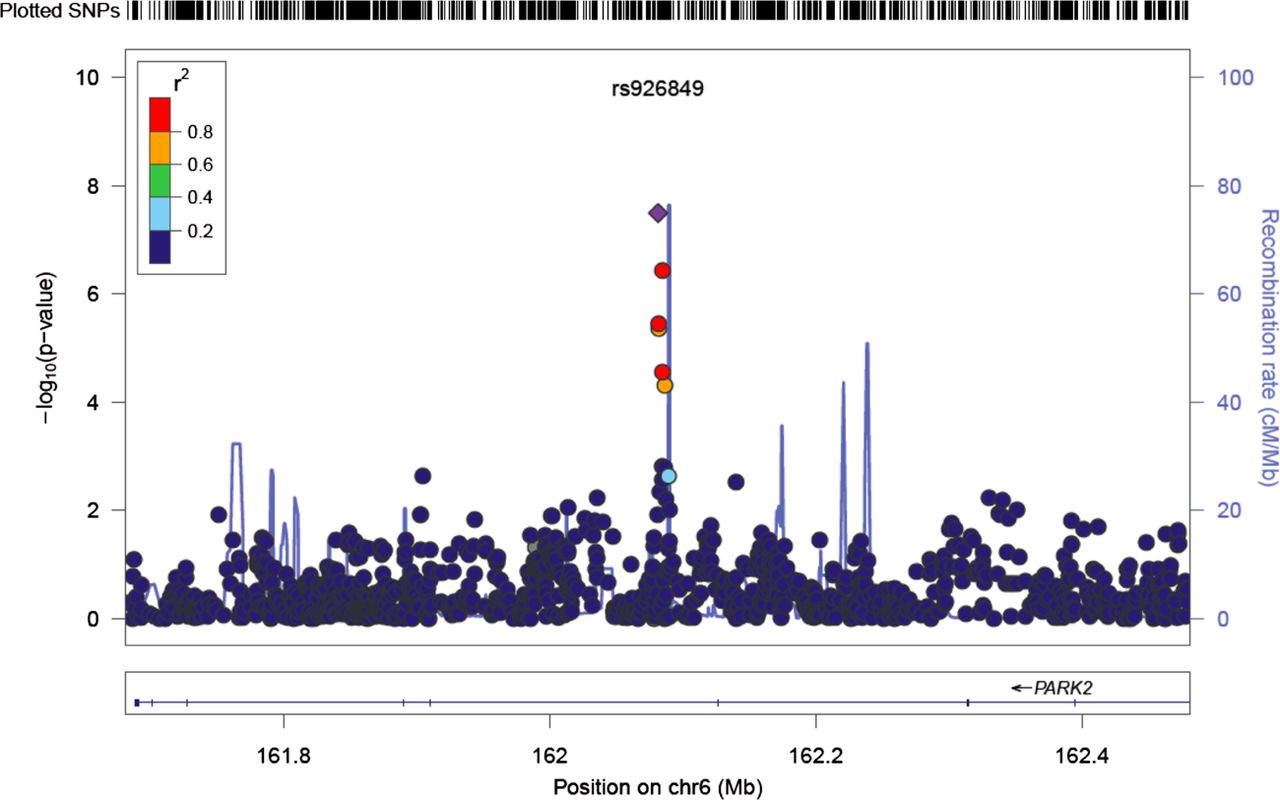
Four markers achieved genome-wide significance in the unadjusted GWAS, of which three were on chromosome 6 (rs926849; rs2187689; rs7767277) and an intergenic marker on chromosome 3 (rs17034687). The results of the meta-analysis adjusted for age and gender were broadly similar: the strongest signal was for SNP rs926849. This SNP lies on an intronic region of the Parkinson protein 2, E3 ubiquitin protein ligase (PARK2) gene on chromosome 6. A Forest plot of the groups’ results and their meta-analysis is shown in figure 3. Data were available from four study groups and the range of estimated minor allele frequencies was 0.23–0.32. Imputation quality was high for all four studies contributing this SNP (>0.90, table 2) and the estimated between-study heterogeneity was acceptable (I2=0%; p(Q)=0.67). The results of a four-study meta-analysis which excluded GARP show the marker to have p=9.5e−8 (unadjusted). The minor or C allele of rs926849 was associated with a lower level of LDD implying that the minor allele is protective. Figure 4 shows a regional plot of both genotyped and imputed SNPs within 200 Kb of the PARK2 gene, along with recombination rates.

Forest plot of rs926849 in PARK2 unadjusted for covariates. The contribution of the studies included in the meta-analysis is shown in this fixed effects model. The C allele is considered. Heterogeneity, I2=0%; p(Q)=0.67. TE, treatment effect; seTE, standard error treatment effect.

Regional plot of association results and recombination rates for the PARK2 gene, unadjusted results. −log10 p values (y-axis) of the single nucleotide polymorphisms (SNPs) are shown according to their chromosomal positions (x-axis) with lead SNP shown as a purple diamond. The colour intensity of each symbol depicting an SNP reflects the extent of LD with the rs926849, coloured red (r2>0.8) through to blue (r2<0.2). Genetic recombination rates (cM/Mb), estimated using HapMap CEU samples, are shown with a light blue line. Physical positions are based on build 36 (NCBI) of the human genome. Also shown are the relative positions of genes mapping to the region of association. Genes have been redrawn to show the relative positions and, therefore, the maps are not to physical scale.
Two of the other strongly associated SNPs are in perfect linkage disequilibrium (LD): rs2187689 and rs7767277 on chromosome 6. Data were available for four studies and the range of estimated allele frequency was 0.06–0.09. Imputation quality was high for all four studies (>0.90). Both SNPs are in strong LD (r2=0.76) with an intronic marker on the proteasome subunit, β type 9, large multifunctional peptidase 2 gene (PSMB9) that is located in the class II region of the major histocompatibility complex (MHC). Both genotyped and imputed SNPs within 400 Kb of rs2187689, along with recombination rates, are shown in a regional plot in online supplementary figure S3. None of these top SNPs is in LD with known functional SNPs in either PARK2 or PSMB9.
We tested for an association between LDD and DNA methylation variants at three CpG sites in the PARK2 promoter. A significant association between DNA methylation at CpG site cg15832436 and LDD (β=8.74×10⁻⁴, SE=2.49×10⁻⁴, p=0.006) was observed. The pattern of hypermethylation with increasing LDD levels was reflected at the remaining promoter CpG sites; however, these did not reach nominal significance (cg21926612 β=0.003, p=0.14; cg24816866 β=6.76×10⁻⁴, p=0.39). We repeated the analyses using normalised methylation levels and observed that the association between cg15832436 and LDD remained nominally significant.
Discussion
GWA offers an unbiased scan of common genetic variants (minor allele frequency >5%) and thus may deliver novel variants in genes not hitherto suspected of playing a role in disc degeneration. This work is among the first to report on a genome-wide meta-analysis being conducted for LDD. LDD is an age-related process which occurs in all people to some extent and may be detected as early as the teenage years.1 LDD is known to have genetic determinants7 ,16 and its expression is also influenced by gender (women develop LDD later), body mass index30–34 and smoking.35 Occupational factors also play a small role in LDD.36 ,37 LDD as determined by MRI has been implicated in the development of episodes of severe and disabling low back pain.3 We undertook this large meta-analysis in order to identify novel genetic variants associated with LDD and to shed light on the underlying pathology of disc degeneration.
GWA data obtained using differing chip technology may be readily compared using imputation with HapMap. In total, 2 552 511 overlapping markers were available in each cohort. We identified four markers having significant association with the LDD phenotype (p<5×10⁻⁸). There was similarity in the results obtained with and without adjustment for the covariates age and sex. A total of 26 markers had p<10−5 in both meta-analyses. As expected, results of the adjusted analyses had slightly attenuated p values (see online supplementary table S2) which likely reflect the confounding effect of age. In both analyses, there were multiple associations to the Human Leukocyte Antigen (HLA) region and to markers in PARK2 (Parkinson protein 2, E3 ubiquitin protein ligase). Among the most significant findings (table 2) is SNP rs926849 that lies at 6q25.2–27 within an intron in the PARK2 gene, a large gene of 1.3 Mb comprising 12 exons. The SNP encodes a change of base from T to C and is reported to have a minor allele frequency of 0.23–0.34 in dbSNP, which is keeping with the findings in our study groups (table 2, figures 3 and 4). Although this SNP has not been directly genotyped by any study group, estimates suggest imputation to be accurate for rs926849 (range 95%–99%, table 2). PARK2 encodes a protein called parkin, which is a component of a multiprotein E3 ubiquitin ligase complex that mediates the targeting of unwanted proteins for proteasomal degradation. This complex also controls the level of proteins involved in cell activities such as cell division and growth: it may be a tumour suppressor protein. Parkin is also involved in mitophagy: it translocates from the cytosol and promotes the degradation of uncoupled mitochondria.38 Parkin is widely expressed in solid organs as well as skeletal muscle (http://www.proteinatlas.org/). Mutations within PARK2 are associated with diverse conditions including autosomal recessive juvenile Parkinson's disease, Alzheimer's disease, diabetes mellitus and several solid tumours (reviewed in39). Parkin may account for the inverse relation between Parkinson's disease and cancer incidence.40 Our findings of hypermethylation with increasing LDD score suggest that PARK2 expression is reduced with increasing disc degeneration but functional studies of intervertebral disc and other spine tissues are needed.
Three further markers in the unadjusted meta-analysis had p<5×10⁻⁸. Marker rs17034687 is an intergenic marker on chromosome 3. Based on One Thousand Genomes (1KG)/CEU data, it is not in LD (r2 > 0.3) with any known gene-based markers. Markers rs2187689 (supplementary figure S2) and rs7767277 are HLA region markers, neither of which is included in the 1KG pilot data. Using data from HapMap V.3 (release 2), rs2187689 and rs776277 are in perfect LD with each other and in LD (r2 = 0.76) with an intronic marker in PSMB9 (proteasome (prosome, macropain) subunit, β type 9; large multifunctional peptidase 2). Proteasomes are distributed throughout eukaroytic cells at high concentration and cleave peptides in an ATP/ubiquitin-dependent process in a non-lysosomal pathway. The gene is located in the class II region of the MHC. Expression of the gene is induced by interferon γ and this gene product replaces catalytic subunit 1 (proteasome β 6 subunit) in the immunoproteasome.
While lumbar degeneration is not considered an inflammatory process and has not been reported to be auto-immune in aetiology, there is evidence of pro-inflammatory cytokine activation in herniated lumbar discs41 and anti-TNF has been used successfully to treat disc herniation-induced sciatica.42 Of note, the COL11A2 gene lies 169 KB upstream from rs2187689. An SNP (rs2076311) within this candidate gene has been shown to be associated with MR determined disc signal intensity in a candidate gene study of Finnish male twins.43 SNP rs2076311 is not, however, in LD with our top hit, rs2187689 (r2=0.017) and so it seems unlikely that this collagen-encoding gene accounts for our observed association. Many published GWA studies have identified SNPs in intergenic regions and the precise role of these regions is yet to be defined. Long range enhancers, for example, could operate here and so an influence on COL11A2 expression cannot be ruled out.
Of suggestive significance is SNP rs4802666 (p=3.76×10⁻⁶, adjusted meta-analysis) which lies within the MYH14 gene which encodes myosin, heavy chain 14, non-muscle. It is expressed in cell lines derived from bone (http://www.proteinatlas.org) and is implicated in autosomal dominant hearing impairment. It is of interest in LDD because it lies on chromosome 19 under the linkage peak we have reported in twins for LDD44 and a peak reported by the Framingham group for hand OA.45 As there is a known relationship between these two phenotypes, this region on chromosome 19 forms a highly plausible candidate region for OA. It is not impossible that a muscle-expressed protein plays a role in LDD through mechanisms similar to those proposed for OA, considered by some to be a multi-tissue syndrome rather than simply a disease of cartilage.46
The main limitation of the study is one of obtaining an accurate phenotype on individuals which is known to be an important factor in the success of GWA.47 There is at present no agreed gold standard imaging method in the determination of LDD, although it is recognised that MRI offers the most sensitive, widely available tool. Even so, MR is relatively expensive and many of the largest spine cohorts in the world have plain radiographs, which offer more limited phenotypic information. The coding method applied to the imaging is also yet to be formally standardised: our interest in the individual subtraits of LDD led us to devise a coding method in which they were separated, as reported previously.7 In order to obtain sufficient sample size, a number of cohorts contributed having different imaging methods, but traits were selected to enable comparison across the cohorts. Thus, study groups recoded their imaging where necessary to meet uniform requirements for inclusion. We included measures of disc height (coded 0–3) and anterior osteophytes in RS1, RS3, GARP and TUK (also coded 0–3) and posterior osteophytes in FHS (coded 0–3). These subphenotypes were summed over the five discs and underwent inverse normal transformation to give a normal distribution. A further limitation is that four cohorts are population samples while GARP is derived from OA-affected sibling pairs. We included GARP because it has made a contribution to similar analyses performed for OA48 and, with adjustment for relatedness, provides data comparable with other studies. While the differing methods of imaging provide different amounts of information so the LDD variable has lower mean in those cohorts with radiographs, the variance is comparable. Where GARP samples made a contribution to the meta-analysis (a number of the significant SNPs did not include a contribution from GARP, table 2), the minor allele frequency was similar to those of other groups. The TUK group has a disproportionate number of women, for historical reasons. The men were retained, however, as they did not differ significantly from women in the LDD variable or body mass index (data not shown). This study lacks a replication group. A second sample of similar size to the first is considered important to show that the findings of the first sample are true positives. Unfortunately there are, to our knowledge, no other collections of Northern Europeans having spine imaging which together would approach our sample size. There is considerable evidence in the literature that the genetic predisposition between Northern Europeans and Asians to OA is different49 and, given the similarities between OA and LDD, we felt replication should be made in Northern Europeans. We elected to include all the subjects in a single, powerful study rather than split the sample and reduce the chances of finding significant novel loci associated with LDD.
In conclusion, this is the first large-scale GWA study of LDD and we have identified several novel variants in the PARK2 gene and in PSMB9 within MHC class 2. We have shown in a small subset that methylation at one of the PARK2 promoters is associated with MRI determined LDD. Both loci merit further investigation to shed light on the important clinical endpoint of low back pain.
Acknowledgments
FMKW is a Wellcome Trust Intermediate Fellow. The authors would like to acknowledge the contribution of Maria Popham to the collection and analysis of TwinsUK data. The GWA study was funded by the Netherlands Organisation of Scientific Research NWO Investments (nr. 175.010.2005.011, 911-03-012), the Research Institute for Diseases in the Elderly (014-93-015; RIDE2) and the Netherlands Genomics Initiative (NGI)/the Netherlands Consortium for Healthy Aging (NCHA) project nr. 050-060-810. We thank Pascal Arp, Mila Jhamai, Dr Michael Moorhouse, Marijn Verkerk and Sander Bervoets for their help in creating the GWAS database. The Rotterdam Study is funded by Erasmus Medical Center and Erasmus University, Rotterdam, the Netherlands Organisation for the Health Research and Development (ZonMw), the Research Institute for Diseases in the Elderly (RIDE), the Ministry of Education, Culture and Science, the Ministry for Health, Welfare and Sports, the European Commission (DG XII), and the Municipality of Rotterdam. The authors are very grateful to the participants and staff from the Rotterdam Study, the participating general practitioners and the pharmacists. We would like to thank Dr Tobias A Knoch, Luc V de Zeeuw, Anis Abuseiris and Rob de Graaf as well as their institutions the Erasmus Computing Grid, Rotterdam, The Netherlands, and especially the national German MediGRID and Services@MediGRID part of the German D-Grid, both funded by the German Bundesministerium fuer Forschung und Technology under grants #01 AK 803 A-H and # 01 IG 07015 G for access to their grid resources. The GARP study was supported by the Leiden University Medical Centre and the Dutch Arthritis Association. Pfizer Inc., Groton, CT, USA supported the inclusion of the GARP study. The genotypic work was supported by the Netherlands Organisation of Scientific Research (MW 904-61-095, 911-03-016, 917 66344 and 911-03-012), Leiden University Medical Centre and the Centre of Medical System Biology and the Netherlands Consortium for Healthy Aging both in the framework of the Netherlands Genomics Initiative (NGI). The research leading to these studies has received funding from the European Union's Seventh Framework Programme (FP7/2007-2011) under grant agreement n° 259679. Pradeep Suri was funded by K12HD01097 from the National Institute of Health (US) and the Rehabilitation Medicine Scientist Training Programme (RMSTP). The Framingham Study is supported by the National Heart, Lung and Blood Institute's Framingham Heart Study contract (No. N01-HC-25195) for the recruitment, enrolment and examination of the Offspring and Third Generation cohorts and the imaging by CT scan.
References
Supplementary materials
Supplementary Data
This web only file has been produced by the BMJ Publishing Group from an electronic file supplied by the author(s) and has not been edited for content.
Files in this Data Supplement:
- Data supplement 1 - Online supplement
Footnotes
ATB and JBM contributed equally.
-
Contributors The authors listed fulfilled the criteria for authorship.
-
Funding Fellowship to FMKW who led the project.
-
Competing interests None.
-
Ethics approval All bodies appropriate to the groups contributing data.
-
Provenance and peer review Not commissioned; externally peer reviewed.
-
Open Access This is an Open Access article distributed in accordance with the Creative Commons Attribution Non Commercial (CC BY-NC 3.0) license, which permits others to distribute, remix, adapt, build upon this work non-commercially, and license their derivative works on different terms, provided the original work is properly cited and the use is non-commercial. See: http://creativecommons.org/licenses/by-nc/3.0/