Article Text

Abstract
Objective Rheumatoid arthritis (RA) accompanies infiltration and activation of monocytes in inflamed joints. We investigated dominant alterations of RA monocytes in bone marrow (BM), blood and inflamed joints.
Methods CD14+ cells from BM and peripheral blood (PB) of patients with RA and osteoarthritis (OA) were profiled with GeneChip microarrays. Detailed functional analysis was performed with reference transcriptomes of BM precursors, monocyte blood subsets, monocyte activation and mobilisation. Cytometric profiling determined monocyte subsets of CD14++CD16−, CD14++CD16+ and CD14+CD16+ cells in BM, PB and synovial fluid (SF) and ELISAs quantified the release of activation markers into SF and serum.
Results Investigation of genes differentially expressed between RA and OA monocytes with reference transcriptomes revealed gene patterns of early myeloid precursors in RA-BM and late myeloid precursors along with reduced terminal differentiation to CD14+CD16+monocytes in RA-PB. Patterns associated with tumor necrosis factor/lipopolysaccharide (TNF/LPS) stimulation were weak and more pronounced in RA-PB than RA-BM. Cytometric phenotyping of cells in BM, blood and SF disclosed differences related to monocyte subsets and confirmed the reduced frequency of terminally differentiated CD14+CD16+monocytes in RA-PB. Monocyte activation in SF was characterised by the predominance of CD14++CD16++CD163+HLA-DR+ cells and elevated concentrations of sCD14, sCD163 and S100P.
Conclusion Patterns of less mature and less differentiated RA-BM and RA-PB monocytes suggest increased turnover with accelerated monocytopoiesis, BM egress and migration into inflamed joints. Predominant activation in the joint indicates the action of local and primary stimuli, which may also promote adaptive immune triggering through monocytes, potentially leading to new diagnostic and therapeutic strategies.
- rheumatoid arthritis
- osteoarthritis
- inflammation
This is an Open Access article distributed in accordance with the Creative Commons Attribution Non Commercial (CC BY-NC 4.0) license, which permits others to distribute, remix, adapt, build upon this work non-commercially, and license their derivative works on different terms, provided the original work is properly cited and the use is non-commercial. See: http://creativecommons.org/licenses/by-nc/4.0/
Statistics from Altmetric.com
Introduction
The principal pathological changes in rheumatoid arthritis (RA) occur in the synovial joints, where inflammation leads to cartilage and bone destruction, thereby reducing physical abilities and quality of life.1 2 Infiltration of monocytes along with T and B cells into the joint and production of inflammatory mediators characterise the immunopathology of this disease. The influence of the monocytic lineage in shaping the immune response is substantial and interferes with both the innate and adaptive arm of immunity. Thus, it is not surprising that controlling inflammation in disease-modifying antirheumatic drug (DMARD) non-responders may be achieved when targeting monocyte-derived cytokines, tumour necrosis factor (TNF), interleukin (IL)-1, IL-6 or monocyte T cell interaction.
Human monocytes represent 5%–10% of the blood leucocytes and their half-life in the vascular compartment is 1 - 3 days.3–5 Based on CD14 and CD16 expression levels, monocytes are categorised into three subsets: classical CD14++CD16−, intermediate CD14++CD16+ and non-classical CD14+CD16+.6 Developmental relationship between the subsets was demonstrated in mice, macaques and humans.7–9 Classical monocytes are the dominant blood population expressing CCR2, a receptor involved in mobilisation from bone marrow (BM) and recruitment to inflammatory sites.10 11 In contrast, non-classical monocytes reduce CCR2 but elevate CX3CR1 surface expression, which is needed for patrolling blood vessels and migrating into resting tissues.6 12 Intermediate monocytes express CCR2 and CX3CR1 on intermediate level and show the highest HLA-DR expression.13
Monocytes develop characteristic gene expression profiles, in systemic lupus erythematosus (SLE) and RA, which are largely influenced by IFN and TNF, respectively.14 It has been shown that even a single biomarker on monocytes might be sufficient to quantify disease activity, like SIGLEC-1 in SLE, or to predict responsiveness to anti-TNF biologicals, like CD11c in RA.15 16 Furthermore, frequencies of classical, intermediate and non-classical blood monocytes were found to alter in patients with RA compared with healthy donors.17–19 The frequencies of blood subsets were skewed by glucocorticoid treatment and may be predictive for the clinical response to methotrexate (MTX) or MTX plus anti-TNF treatment.13 20–22 However, results are in part contradictory, which might be explained by different techniques of monocyte purification and by difficulties to capture intermediate monocytes properly.23 In general, it was assumed that in inflammatory conditions, such as RA, phenotypical and quantitative alterations affect monocyte blood subsets and are associated with release of immature and younger myeloid cells from BM.24 This so called ‘left-shift’ in monocytopoiesis can be suppressed, at least partially, with administration of certain drugs like anti-GM-CSF and MTX.25
To investigate the role and involvement of monocytes in RA pathogenesis from a systemic point of view, we profiled transcriptomes of BM and blood monocytes. This comprehensive approach revealed left-shift patterns as dominant changes in both RA-BM and RA-peripheral blood (PB), suggesting increased turnover of RA monocytes, characterised with increased monocytopoiesis, faster egress from BM and skewed distribution of monocyte subsets. We therefore hypothesised that increased monocyte turnover might be associated with their recruitment into inflamed joints. To confirm these observations, we applied cytometric profiling of BM, PB and synovial fluid (SF) monocytes, which provided additional insight into heterogeneity and various differentiation stages of monocyte subsets in BM, blood and SF.
Materials and methods
Sample collection for transcriptome, flow cytometry and ELISA analyses
All samples for transcriptome analysis and paired samples of BM and blood for cytometry were collected at the Rheumoorthopaedic Clinic of the Institute of Rheumatology in Warsaw, Poland. Paired samples of blood and SF investigated by cytometry and ELISA and blood samples from RA and healthy donors investigated by cytometry were collected at the Department of Rheumatology of the Charité Universitätsmedizin, Berlin, Germany. All patients gave written informed consent. Patients’ characteristics are summarised in table 1. Detailed overview of sample collection and processing is included in online supplementary material.
Supplementary file 1
Clinical data of patients included in the study
RNA isolation, Affymetrix GeneChip hybridisation and quality controls for gene expression analyses
RNA preparation, quality controls and array hybridisation were performed as previously described and were included in online supplementary material.26 27
Statistical and functional analyses of microarray data
Analysis with the BioRetis database (www.bioretis.com) consisted of MAS5.0 pair-wise comparison statistics as previously described to select probe sets differentially expressed in at least 60% of all pair-wise comparisons between RA and osteoarthritis (OA) samples.14 27–29 Details of functional interpretation with Gene Ontology (GO), Ingenuity Pathway Analysis (IPA) and comparison with reference signatures are provided in online supplementary material.
Analysis of flow cytometry data
Matched BM and blood samples from patients with OA and RA, matched blood and synovial samples from patients with RA and blood samples from RA and healthy donors were analysed by unsupervised clustering with immunoClust.30
Statistical analyses of protein data
GraphPad Prism V.6.0b was used for statistical analysis of ELISA data. Groups were compared by Mann-Whitney U-test, and P values <0.05 were considered significant. For comparing monocyte subsets between groups, either unpaired or paired t-test was applied (described in figure legends).
Results
RA-related transcriptional changes in BM, and blood monocytes are different and more prominent in blood
Comparison between BM monocytes from patients with RA and OA identified differential expression of 221 probe sets. Probe sets upregulated in RA (n=111) performed better to distinguish between RA and OA (figure 1A and online supplementary table 1). Comparison between blood monocytes from RA and OA revealed 379 differentially expressed probe sets (figure 1B and online supplementary table 2). Leading genes upregulated in RA-BM included TMTC1, HOPX, IL1R2, FLT3 and CLU, while those upregulated in RA-PB monocytes included CCR2, CXCR4, CD163, IL1R2 and S100P. Altogether, BM and PB revealed 571 differentially expressed probe sets with only 29 common for both compartments (online supplementary table 3). Principal component analysis (PCA) with all differentially expressed probe sets from BM and PB showed that RA-PB were localised between OA-PB and samples from BM (figure 1C and online supplementary movie). Calculated distances between RA-PB, OA-PB, RA-BM and OA-BM confirmed proximity of RA-PB samples to RA-BM and OA-BM (online supplementary figure 1).
Supplementary file 2
Supplementary file 3
Supplementary file 4
Supplementary file 5
Supplementary file 6
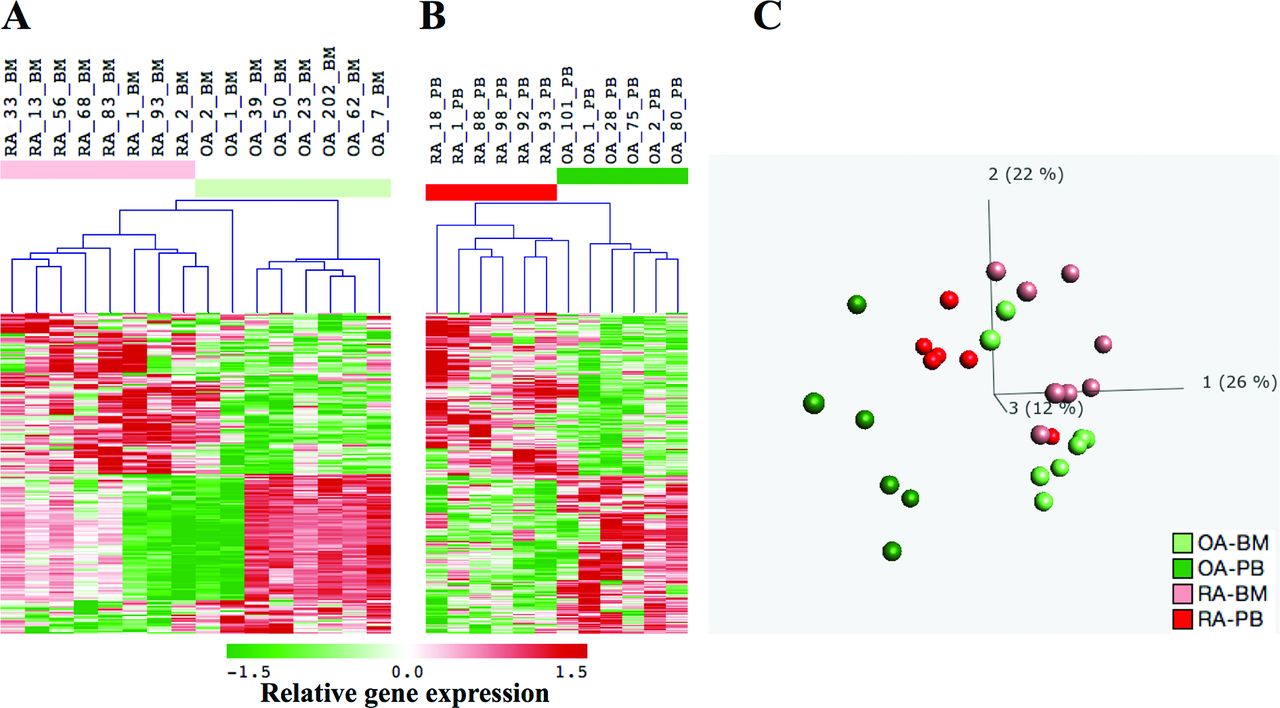
Genes differentially expressed between RA and OA in BM and blood monocytes. Hierarchical clustering was performed with (A) eight RA-BM and eight OA-BM profiles defined by 221 probe sets (141 genes) and with (B) six RA-PB and six OA-PB profiles defined by 379 probe sets (286 genes; Affymetrix annotation release 35; 4/16/15). Rows represent the probe sets, and columns represent the samples with relative intensities as indicated by the scale bar. (C) Using the combined set of 571 probe sets differentially expressed in BM and blood profiles, principal components analysis (PCA) revealed the largest distance between OA-PB and RA-BM monocytes, while RA-PB monocytes shifted towards BM. The first three principal components, PC1, PC2 and PC3, explained 26%, 22% and 12% of the variance in the data set, respectively. BM samples were coloured in light red (RA) and light green (OA) and blood samples in red (RA) and green (OA). BM, bone marrow; OA, osteoarthritis; PB, peripheral blood; RA, rheumatoid arthritis.
GO and IPA suggest altered haemopoiesis, antiapoptosis and inflammatory response in RA
GO and IPA annotated the differences in RA-BM and RA-PB monocytes to ‘inflammatory response’, ‘anti-apoptosis’ and ‘hemopoiesis’ (online supplementary table 4). The dominant molecular network was characterised by interleukin (IL)-8 and IL10 in RA-BM and by TNF and CCL2 in RA-PB monocytes (online supplementary figure 2). Although with only few genes overlapping, all three functions were evident both in RA-BM and RA-PB monocytes.
Supplementary file 7
Supplementary file 8
Reference transcriptomes disclosed functional patterns of precursor activity and weak inflammatory response in RA BM and blood
This more comprehensive functional analysis for development, differentiation and activation of monocytes was guided by (1) the proximity of RA-PB monocytes to BM samples as shown by PCA and (2) altered haemopoiesis and inflammation as suggested by GO and IPA, since these alterations were common both for RA-BM and RA-PB monocytes. For this purpose, we selected transcriptomes from Gene Expression Omnibus, which provide a reference for the myeloid lineage of haemopoiesis in BM, monocyte activation and differentiation in blood and cell mobilisation from BM into blood triggered by G-CSF.8 14 27 31 32 In these reference transcriptomes, we tested differentially expressed genes in RA and OA monocytes for their involvement in myelopoiesis, monocyte differentiation, activation and mobilisation.
Analysis of RA-BM upregulated genes emphasised few clusters: early and late myelopoiesis, G-CSF mobilisation and TNF/LPS stimulation (figure 2A–C). The early myelopoietic cluster included genes highly expressed in haematopoietic stem cells (HSC) and early BM progenitors. The late myelopoietic cluster depicted genes highly expressed in band cells (BC) and polymorphonuclear (PMN) from BM and partially overlapped with the G-CSF cluster. Discontinuation of the early haematopoietic cluster and onset of the late myelopoietic cluster in RA-BM monocytes occurred at the stage of myelocytes/metamyelocytes (MY/MM). This observation complements the line of evidence reported for granulocytopoiesis in BM, which shows that the MY/MM developmental stage is crucial for termination of proliferation and subsequent acquisition of phagocytic potential.33 Thus, applying transcriptomes of early myeloid and late myeloid progenitors committed to the granulocyte lineage, we identified (1) a cluster common for BM monocytes and early progenitors and (2) a cluster common for monocytes and granulocytes. Furthermore, the G-CSF gene pattern was pronounced and consisted of genes expressed in purified monocytes like ADAM10, CLU, FAS, IL1R2 and THBD. The cluster related to TNF/LPS response included ALCAM1, ARF6, IL10, TNFAIP6 and SOCS3.

Identification of the functional patterns in RA and OA BM monocytes based on reference transcriptomes. Reference transcriptomes for myelopoiesis (n=34), monocyte activation (n=18), differentiation (n=8) and G-CSF induced leucocyte mobilisation (n=8) were applied to recognise functional patterns in the 221 probe sets differentially expressed between RA-BM and OA-BM monocytes. In total, 111 probe sets were upregulated in RA (A–C) and 110 were upregulated in OA (D–F). The signal intensities from the reference transcriptomes (C and F) were correlated, and obtained correlation coefficients were hierarchically clustered as shown by matrices in B and E. The orders of probe sets determined by these matrices were applied to sort 111 probe sets in RA (A) and 110 probe sets in OA (D). The same orders were applied to sort probe sets of the 68 reference transcriptomes in C and F. Calculation of scores that demonstrated relevance of identified functional patterns is included in online supplementary figures 9–13. Red indicates increased signal expression (max=2) or positive correlation (max=1), and green indicates decreased signal expression (min=−2) or negative correlation (min=−1). Samples in A and D represented RA-BM (n=8, light red) and OA-BM (n=8, light green). Samples in C and F, coloured in yellow, included haematopoietic stem cells (HSC; n=4), multipotent progenitors (MPP; n=2), common myeloid progenitors (CMP; n=3), megakaryocyte–erythrocyte progenitors (MEP; n=2), granulocyte–monocyte progenitors (GMP, n=5), early promyelocytes (early-PM; n=3), late promyelocytes (late-PB; n=3), myelocytes (MY; n=2), metamyelocytes (MM; n=3), band cells (BC; n=4) and polymorphonuclear cells (PMN; n=3). Samples in C and F, coloured blue, included blood monocytes: unstimulated for 0 min (Ctr_0, n=3), unstimulated for 90 min (Ctr_90, n=3,), stimulated for 90 min with TNF (n=3), or LPS (n=3) or IFNγ (n=3) or IFNα (n=3). Samples in C and D, coloured in violet, included monocyte subsets of Mo-CD16− (n=3) and Mo-CD16+ (n=3). Samples in C and D, coloured in cyan, included all leucocytes before G-CSF stimulation (WB pre.G-CSF, n=5) and after stimulation with G-CSF for 5 days (WB post.GCSF, n=5). BM, bone marrow; G-CSF, granulocyte-colony stimulating factor; IFNα, interferon alpha; IFNγ, interferon gamma; LPS, lipopolysaccharide; OA, osteoarthritis; RA, rheumatoid arthritis; TNF, tumour necrosis factor.
By analysing genes upregulated in OA-BM monocytes, we identified a cluster that dominated in late stage of myelopoiesis (figure 2D–F). Contrary to RA, no G-CSF-inducible pattern was evident in OA-BM monocytes.
Genes upregulated in RA-PB monocytes consisted of a late myelopoietic cluster, which was covered by the far more extensive cluster of genes inducible by G-CSF (figure 3A–C). It emphasised a left-shifted monocytopoiesis and faster mobilisation of monocytes from BM. The cluster related to TNF/LPS stimulation was more pronounced than in BM and included the genes ADM, AQP9, S100P and TNFAIP6. The cluster of terminally differentiated CD14+CD16+ monocytes was under-represented and indicated the reduced frequencies of this monocyte subset in RA-PB.

Identification of the functional patterns in RA and OA blood monocytes based on reference transcriptomes. In total, 379 probe sets were differentially expressed between RA-PB and OA-PB monocytes. They were divided into two groups: 192 probe sets upregulated in RA-PB (A–C) and 187 probe sets upregulated in OA-PB (D–F). They were analysed by the reference transcriptomes as described in figure 2. Samples were labelled as described in figure 2. Calculation of scores that demonstrated relevance of identified functional patterns is described in online supplementary material and included in online supplementary figures 9–13. G-CSF, granulocyte-colony stimulating factor; HSC, haematopoietic stem cells; OA, osteoarthritis; PB, peripheral blood; RA, rheumatoid arthritis.
Analysis of upregulated genes in OA-PB disclosed a strong CD16+ cluster, depicted by the genes CDKN1C, TCF7L2, CSF1R and MTSS1. Similar to OA-BM monocytes, OA-PB monocytes did not exhibit a G-CSF pattern, indicating undisturbed kinetics of monocyte egress from BM (figure 3D–F).
Potential contamination of the blood monocytes from RA and OA patients with neutrophils, CD4+T−, CD8+T−, CD19+B- and CD56NK-cells was excluded by mapping the differentially expressed genes in RA and OA to cell type-specific transcriptomes in the coexpression analysis (online supplementary figure 3).
Supplementary file 9
Cytometric profiling of BM, blood and SF confirmed transcriptome data and indicated monocyte activation in the joint
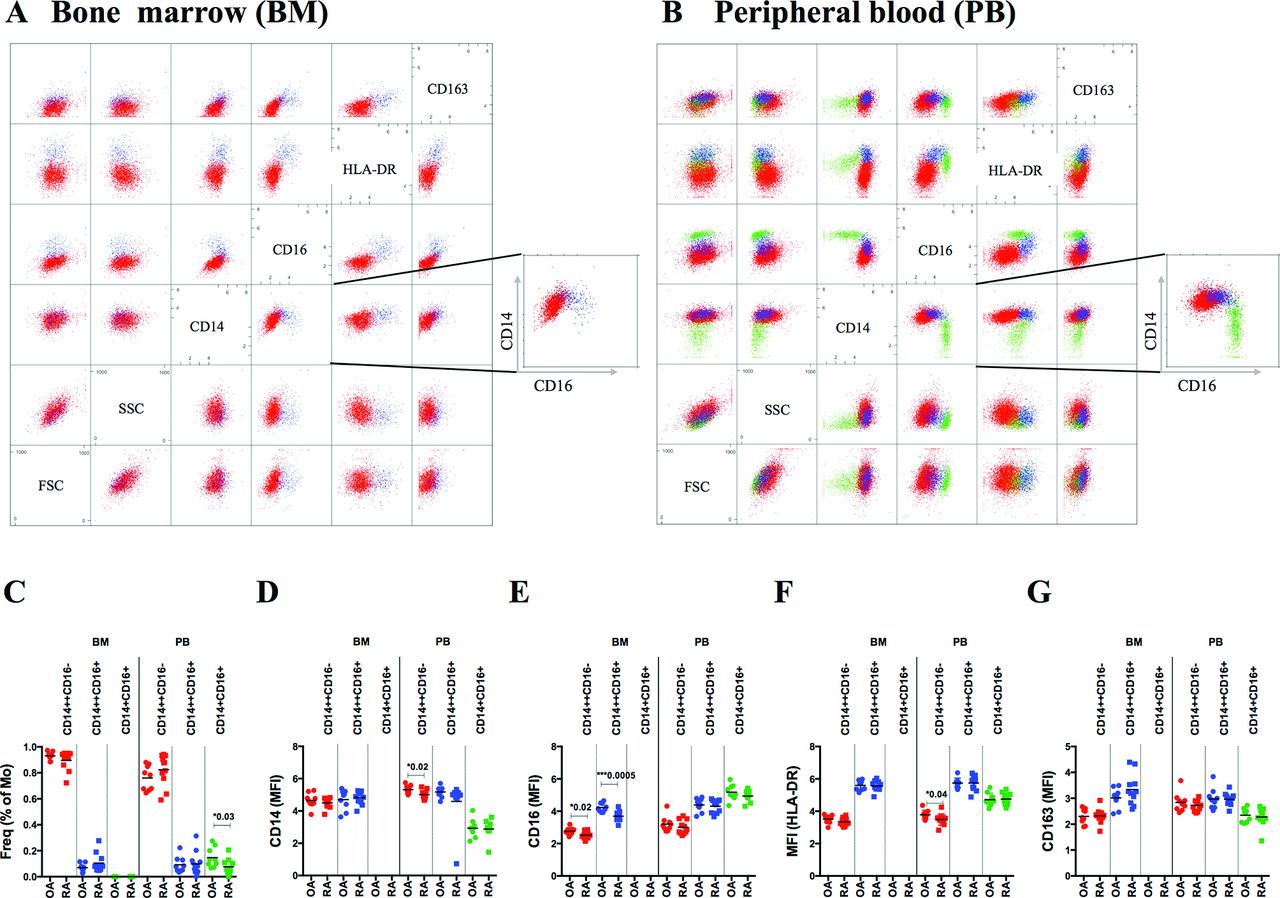
Automated analysis with the immunoClust algorithm, unsupervised clustering tool, identified in the blood the three subsets of monocytes based on size, granularity, CD14, CD16 and HLA-DR expression (figure 4B).30 Automated analysis of monocytes included (1) exclusion of dead cells and cell doublets and (2) exclusion of granulocytes and lymphocytes (online supplementary figures 4A,B and 5). All three compartments, BM, blood and SF, revealed their own distribution of monocyte subpopulations (figures 4 and 5). Classical monocytes were the dominant subset in BM and blood but were absent in SF. Intermediate monocytes were a minor subset in BM, increased in blood and were the dominant population in SF. Non-classical monocytes were absent in BM and clearly distinguishable in blood but less obvious in SF. Besides differences in CD14 and CD16 expression on these subpopulations, HLA-DR was highest in intermediate followed by non-classical and classical monocytes (figure 4F). CD163 also increased in intermediate but dropped in non-classical to the lowest level (figure 4G). Comparing RA with OA, BM subpopulations were similar in frequency but revealed decreased CD16 expression in RA (figure 4E). In blood, frequency of non-classical and expression of CD14 and HLA-DR on classical monocytes was reduced in RA (figure 4C–F).

Cytometric analysis of monocyte subsets in BM and blood from patients with RA and OA. Paired BM and blood samples from OA (n=9) and RA (n=11) patients were investigated for CD14, CD16, CD163 and HLA-DR expression. Data were analysed by immunoClust. Scatterplot matrices from BM (A) and blood (B) samples of one representative patient demonstrate classical (CD14++CD16−; red), intermediate (CD14++CD16+; blue) and non-classical (CD14+CD16+; green) monocytes. Intermediate monocytes are distinguished from classical and non-classical by increased HLA-DR expression. (C) In BM, two monocyte subsets were detected (mean frequency of CD14+ cells±SD): CD14++CD16− (RA: 89.6%±7.2%; OA: 93.0%±3.0%) and CD14++CD16+ (RA: 10.4%±7.2%; OA: 7.0%±3.0%), while CD14+CD16+ monocytes were absent. In blood, three monocyte subsets were detected: CD14++CD16− (RA: 82.5%±12.0%; OA: 76.1%±9.5%), CD14++CD16+ (RA: 9.9%±9.1%; OA: 9.2%±6.1%) and CD14+CD16+ (RA: 7.6%±5.7%; OA: 14.7%±7.7%). Distribution of asinh-transformed median fluorescence intensity (MFI) is presented for CD14 (D), CD16 (E), HLA-DR (F) and CD163 (G). Differences in frequencies and in MFIs of CD14, CD16, HLA-DR and CD163 between RA and OA monocyte subsets in BM and blood were calculated by unpaired t-test and significance was indicated with P value. OA, osteoarthritis; RA, rheumatoid arthritis.

![[annrheumdis-2017-211649-SP6.jpg]](https://ard.bmj.com/content/annrheumdis/77/2/300/DC6/embed/inline-supplementary-material-6.jpg?download=true)
![[annrheumdis-2017-211649-SP8.jpg]](https://ard.bmj.com/content/annrheumdis/77/2/300/DC8/embed/inline-supplementary-material-8.jpg?download=true)
![[annrheumdis-2017-211649-SP9.jpg]](https://ard.bmj.com/content/annrheumdis/77/2/300/DC9/embed/inline-supplementary-material-9.jpg?download=true)
Cytometric analysis of monocyte subsets in blood and SF from patients with RA. Paired samples of blood and SF from six patients with RA were investigated for CD14, CD16 and HLA-DR expression. Scatterplot matrices from blood (A) and SF (B) samples of one representative patient demonstrate classical (CD14++CD16−; red), intermediate (CD14++CD16+; blue) and non-classical (CD14+CD16+; green) monocytes. In SF, monocytes with classical and non-classical CD14/CD16 pattern were absent, and ~20% of cells displayed myeloid phenotype (cyan). The dominant population in SF was similar to intermediate monocytes of blood but with increased CD14 and HLA-DR expression (significance determined by paired t-test was indicated with P value). Distribution of asinh-transformed mean fluorescence intensity (MFI) is presented for CD14 (D), CD16 (E), HLA-DR (F). Staining of CD163 with CD14 and CD16 was performed independent of HLA-DR, and thus it is not included in the scatterplot matrix, but it is shown in figure part G. RA, rheumatoid arthritis.
In the synovial compartment, characteristics of subpopulations changed. The dominant intermediate population revealed higher CD14 and HLA-DR expression than in the blood and expressed high levels of CD16 (figure 5D–F). Percentage of CD14++CD16+ cells in SF correlated with inflammation (online supplementary figure 6A). Another population of CD14+CD16+ cells in SF did not exceed 20% of all monocytes and when compared with blood subsets, HLA-DR was similar to intermediate, CD14 reduced to levels of non-classical, CD16 was slightly higher than classical and CD163 was similar to classical and intermediate subsets. Their frequency was negatively correlated with erythrocyte sedimentation rate (online supplementary figure 6B). We validated the observed differences in frequency of monocyte subpopulations with independent blood samples and confirmed that non-classical monocytes are decreased in blood from RA patients when compared with healthy donors (online supplementary figure 7).
Supplementary file 12
![[annrheumdis-2017-211649-SP12.jpg]](https://ard.bmj.com/content/annrheumdis/77/2/300/DC10/embed/inline-supplementary-material-10.jpg?download=true)
Supplementary file 13
![[annrheumdis-2017-211649-SP13.jpg]](https://ard.bmj.com/content/annrheumdis/77/2/300/DC11/embed/inline-supplementary-material-11.jpg?download=true)
Markers shedded or released from monocytes confirm monocyte activation
The soluble markers sCD14, sCD163 and S100P, which relate to monocyte activation, were determined by ELISA in paired samples of serum and SF from RA and OA patients and in serum from healthy donors (online supplementary figure 8). Differences were highly significant between RA and OA in SF, and levels of sCD14 and S100P were up to 10 times higher in RA SF compared with serum. In serum, sCD14 and S100P were still able to discriminate RA both from OA and ND, while sCD163 discriminated RA only from ND.
Supplementary file 14
![[annrheumdis-2017-211649-SP14.jpg]](https://ard.bmj.com/content/annrheumdis/77/2/300/DC12/embed/inline-supplementary-material-12.jpg?download=true)
Discussion
This study identified that RA-related transcriptional changes in the monocyte lineage are dominated by left-shift patterns in BM and blood, suggesting increased monocytopoiesis, premature egress from BM and reduced differentiation in the blood. In detail, RA-BM profiles revealed patterns of (1) early myeloid precursor cells and (2) stimulated myelopoiesis (G-CSF), while RA-PB profiles depicted patterns of (1) late myelopoietic precursors, (2) extended G-CSF induction and (3) reduced CD16+ differentiation. Cytometry identified reduced CD16 expression in RA-BM monocytes and reduced frequencies of non-classical RA-PB monocytes, which confirmed transcriptome data. Comparing BM, blood and SF monocytes, a distinct intermediate-like but more activated population appeared only in the joint, which expressed high levels of both CD14 and CD16 along with increased levels of CD163 and HLA-DR. Shedded (sCD14 and sCD163) and released (S100P) markers of monocyte activation were also highest in RA SF and lower but still elevated in RA compared with OA serum.
These analyses indirectly suggest (1) an increased monocyte turnover, (2) reduced circulation time in the blood and (3) the most prominent activation of RA monocytes in the joints. This may have substantial implications for interpretation of pathomechanisms and for detection of biomarkers of disease activity or drug response.
Transcriptome technology was applied in this study as comprehensive genome-wide approach in order to recognise the early and leading molecular mechanisms that affect BM and blood monocytes in RA. Comparison with reference transcriptomes revealed the most reliable and unambiguous results to identify the functional relevance of differentially expressed transcripts on a quantitative and technologically comparable level instead of literature-based annotations.
In detail, RA transcriptomes of BM and blood monocytes overlapped with signatures of precursors in myelopoietic differentiation, indicating a so-called ‘left-shift’. Accelerated monocytopoiesis in RA-BM can be deduced from patterns increased in early (HSC, multipotent progenitors (MPP), megakaryocyte–erythrocyte progenitors (MEP), common myeloid progenitors (CMP), granulocyte–monocyte progenitors (GMP), early and late promyelocytes (PM) and MY) but reduced in late-stage myelopoiesis (MMs, band cells (BCs) and PMN cells and from increased G-CSF response patterns. ‘Left-shift’ in RA-PB monocytes is indicated by a largely extended G-CSF response pattern, which includes late stage myelopoiesis (MM, BC and PMN) as well as typical monocyte genes of the classical CD16− subset. Interestingly, development up to PMs still includes proliferation and subsequent stages more phagocytosis-related capabilities, suggesting that ‘left-shift’ in the BM is dominated by proliferation and in the blood by maturation processes.33
This accelerated monocytopoiesis is supported by earlier observations that RA haematopoietic precursors differentiate in vitro more rapidly into CD14+ HLA-DR expressing monocytes than non-inflammatory controls.34 Furthermore, cell anchoring during myelopoiesis to the BM matrix is mediated by integrins and their release by proteases.35–38 In line with this concept, we showed that RA-BM monocytes expressed higher levels of integrins ITGA4 and ITGB1 like their early precursors and also elevated sheddase ADAM10, which is involved in their release from BM and also induced by G-CSF.35 36 38 Egress of monocytes from BM was also associated with CCR2 activation and desensitisation of CXCR4 anchoring to BM stromal cells.10 11 39 Both chemokine receptor transcripts were highly expressed on BM monocytes in both RA and OA. In line with a ‘left-shift’ in RA-PB monocytes, CCR2 expression was increased in RA and decreased during differentiation from CD14+CD16− to CD14+CD16+ subsets.8 13 40 In contrast to RA, monocyte genes increased in OA overlapped with more differentiated progenitors in the BM and with a more differentiated subset of CD16+ monocytes in the blood.
On this background, cytometry also reflected the ‘left-shifted’ monocytopoiesis by reduced CD16 expression on classical and intermediate monocytes in RA-BM when compared with OA. Additionally, the decreased frequency of non-classical CD14+CD16+ RA monocytes in blood indicated reduced terminal differentiation in RA. Altogether, a ‘left-shift’ pattern and reduced differentiation in RA-PB raise the hypothesis of increased production, a shorter circulation time and faster migration into inflamed tissues. These conclusions are in line with cell tracking experiments in macaques, performed by in vivo BrdU staining, which is not possible in humans. These experiments demonstrated that lower CD14 expression on classical monocytes was related to younger cells and that the frequency of the terminally differentiated non-classical subset increased with circulation time.9 41
When investigating the joint compartment, the most obvious change was the absence of classical monocytes. The dominant population was similar to the intermediate phenotype of blood and revealed even further increase of HLA-DR, CD14 and CD163 expression compared with blood. As these markers were not different between RA and OA monocyte subsets in the blood, this indicates that activation occurred in the joint and that it was related to the intermediate subset. This is also emphasised by the high concentrations of shedded sCD14 and sCD163 and of released S100P in RA SF. The second population of CD14+CD16+ SF monocytes was small and may, according to the described phenotype, reflect differentiation towards typical tissue macrophages, which may not propagate activation and inflammation.
Recently, we demonstrated that response to MTX in RA is related to a predominance of innate immune activation.42 Correspondingly, Ponchel et al 43 associated higher naïve T cell frequency with response to MTX. Thus, immunopathology of RA appears not independent of innate triggers and becomes more aggressive and difficult to treat when adaptive immune response gains dominance. Translating innate to adaptive immunity depends on monocytes, their activation by innate triggers, their antigen processing and presentation and their interaction with T cells. This might explain why combination of MTX with biologicals advances treatment of RA patients with reduced naïve T cells and more lymphocyte involvement.43
There is ongoing discussion about the primary site of RA initiation, which may occur either inside the joints or outside in organs, where immune cells develop (BM and lymph nodes) or interact with environment (gut, lung and gingiva).44–46 Our results suggest that disease-specific triggering occurs in the joint, where search for biomarkers relevant for drug selection seems to be more promising. How and to what extent monocytes are triggered and, consequently, what is the magnitude of the innate and adaptive immune system activation seem to be essential to improve insight into RA aetiopathogenesis.
Supplementary file 10
![[annrheumdis-2017-211649-SP10.jpg]](https://ard.bmj.com/content/annrheumdis/77/2/300/DC13/embed/inline-supplementary-material-13.jpg?download=true)
Supplementary file 11
![[annrheumdis-2017-211649-SP11.jpg]](https://ard.bmj.com/content/annrheumdis/77/2/300/DC14/embed/inline-supplementary-material-14.jpg?download=true)
Supplementary file 15
![[annrheumdis-2017-211649-SP15.jpg]](https://ard.bmj.com/content/annrheumdis/77/2/300/DC15/embed/inline-supplementary-material-15.jpg?download=true)
Supplementary file 16
![[annrheumdis-2017-211649-SP16.jpg]](https://ard.bmj.com/content/annrheumdis/77/2/300/DC16/embed/inline-supplementary-material-16.jpg?download=true)
Supplementary file 17
![[annrheumdis-2017-211649-SP17.jpg]](https://ard.bmj.com/content/annrheumdis/77/2/300/DC17/embed/inline-supplementary-material-17.jpg?download=true)
Supplementary file 18
![[annrheumdis-2017-211649-SP18.jpg]](https://ard.bmj.com/content/annrheumdis/77/2/300/DC18/embed/inline-supplementary-material-18.jpg?download=true)
Supplementary file 19
![[annrheumdis-2017-211649-SP19.jpg]](https://ard.bmj.com/content/annrheumdis/77/2/300/DC19/embed/inline-supplementary-material-19.jpg?download=true)
Supplementary file 20
![[annrheumdis-2017-211649-SP20.jpg]](https://ard.bmj.com/content/annrheumdis/77/2/300/DC20/embed/inline-supplementary-material-20.jpg?download=true)
Acknowledgments
We are grateful to Silvia Pade from the Department of Rheumatology at the Charité for sample and clinical data acquisition. For generating gene expression data, we are thankful to Heidi Schliemann and Heike Hirseland from the Regine-von-Ramin Laboratory of Molecular Rheumatology and to Neeraj Tandon from the Department of Rheumatology and Clinical Immunology, Charité Universitätsmedizin. We would also like to thank Toralf Kaiser and Jenny Kirsch from the core facility of flow cytometry and cell sorting at the German Rheumatism Research Centre for their excellent support in performing cell sorting experiments. We are thankful to Hans-Joachim Mollenkopf from the Max Plank Institute for Infectious Biology in Berlin for valuable discussion.
References
Footnotes
AR and EK-W contributed equally.
Handling editor Tore K Kvien
Contributors All authors meet the criteria for authorship. Conceived and designed the research: BiS, AG, AndR, WM, GRB and TH. Performed research: BiS, AnnR, EKW, WK, JRG, BrS and TH. Analysed data: BiS, AG, USW, TS and TH. Recruitment of patients and clinical investigation: AB, SH, SO, KA, MB and TH. Wrote the paper: BiS, AG, WM and TH.
Funding The work was supported by the European Union with the project AutoCure (LSHB-CT-2006-018861) and the IMI project Be The Cure (contract no 115142-2), the German Federal Ministry of Education and Research (BMBF) with the network project ArthroMark (01EC1009A) and the Deutsche Forschungs gemeinschaft (DFG) with the project SFB 650.
Competing interests None declared.
Patient consent Obtained.
Ethics approval Institutional Ethics Committees in Poland and Germany approved this study.
Provenance and peer review Not commissioned; externally peer reviewed.