Article Text

Abstract
Objectives To identify and synthesise the best available evidence on the accuracy of the currently available tools for predicting fracture risk.
Methods We systematically searched PubMed MEDLINE, Embase and Cochrane databases to 2014. Two reviewers independently selected articles, collected data from studies, and carried out a hand search of the references of the included studies. The Quality Assessment Tool for Diagnostic Accuracy Studies (QUADAS) checklist was used, and the primary outcome was the area under the curve (AUC) and 95% CIs, obtained from receiver operating characteristic (ROC) analyses. We excluded tools if they had not been externally validated or were designed for specific disease populations. Random effects meta-analyses were performed with the selected tools.
Results Forty-five studies met inclusion criteria, corresponding to 13 different tools. Only three tools had been tested more than once in a population-based setting: FRAX (26 studies in 9 countries), GARVAN (6 studies in 3 countries) and QFracture (3 studies in the UK, 1 also including Irish participants). Twenty studies with these three tools were included in a total of 17 meta-analyses (for hip or major osteoporotic fractures; men or women; with or without bone mineral density).
Conclusions Most of the 13 tools are feasible in clinical practice. FRAX has the largest number of externally validated and independent studies. The overall accuracy of the different tools is satisfactory (>0.70), with QFracture reaching 0.89 (95% CI 0.88 to 0.89). Significant methodological limitations were observed in many studies, suggesting caution when comparing tools based solely on the AUC.
- Osteoporosis
- Bone Mineral Density
- Epidemiology
Statistics from Altmetric.com
Introduction
The major clinical consequence of osteoporosis is the occurrence of fragility fractures.1 Osteoporotic fractures lead to significant suffering, disability and mortality, resulting in enormous costs for individuals and society.2 Predicting the absolute risk of osteoporotic fractures is, therefore, of the utmost importance to optimise prevention strategies.
The operational definition of osteoporosis provided by the WHO is a bone mineral density (BMD) 2.5 or more SDs below the average value for young healthy individuals of the same gender and ethnic background (T-score ≤−2.5).3–5 However, BMD has limited sensitivity and specificity in the prediction of fracture.6–8 In fact, a large number of conditions have been firmly established as risk factors for the occurrence of fragility fractures, independently of BMD, and include age, gender, body mass index, family history of fractures, ethnicity, premature menopause, glucocorticoid use, rheumatoid arthritis, hyperthyroidism, hyperparathryoidism, Cushing's, anorexia nervosa, malabsorption, falls, previous fractures, smoking, high caffeine intake and alcohol abuse.9–16 These have been combined into prediction algorithms to estimate fracture probability. When applied upon the baseline epidemiology of fragility fractures in a given population, these algorithms or tools provide estimates of absolute risks. The use of these tools, combined with intervention thresholds, is recommended by many international treatment guidelines.17–19 However, the existing tools differ from each in many relevant aspects: their feasibility, the number and availability of clinical risk factors included, the accessibility of BMD measurements and, finally, their performance in different settings. Such diversity calls for an integrative systematic review (SR) upon which the critical appraisal and selection of tools to be used in clinical practice and research can be based. The existing reviews20–23 have a number of important limitations, such as exclusion of males, disregard of some relevant prediction algorithms, lack of meta-analysis where applicable and, naturally, omission of important subsequent publications.
The aim of this SR and meta-analysis is to bring together and describe all relevant evidence on the structure and performance of the currently available tools to predict fracture risk in the general population, while overcoming the above limitations.
Methods
This study was conducted in line with the guidelines of the Cochrane Collaboration and our findings are reported according to the Preferred Reporting Items for Systematic Reviews and Meta-Analyses (PRISMA) statement.24 ,25
Protocol and registration
The reviewers (AM, RJOF) and a mentor (JAPS) established the protocol for this SR. Advanced technical advice was obtained from experts (LC, EL, ES). This protocol was not published but is available upon request.
Eligibility criteria
We established the following inclusion criteria for studies:
Population—general adult population, both men and women
Intervention/test—any fracture risk prediction tool, score, algorithm or other instruments available to predict risk of fracture (with or without BMD measurement)
Comparator/control—because we wished to evaluate the performance of prediction tests, we defined the observed occurrence of the event of interest—osteoporotic fracture—as the ‘gold standard’
Outcome/performance—the primary outcome measure was the area under the curve (AUC) of the fracture risk prediction and its SE, obtained from receiver operating characteristic (ROC) analysis, in the predetermined prediction time-interval. This was chosen as the primary outcome because the AUC represents the accuracy of the predictive model, that is, the probability that a randomly chosen subject with fracture is correctly rated or ranked with greater risk than a randomly chosen individual without fracture26
Design—cohort studies (either prospective or retrospective) and case–control studies if past data were available for all subjects.
Osteoporotic fracture risk prediction tools were only included in the final analyses if they were developed from an initial population (derivation model) and then externally validated in a different population (validation model), to prevent overestimated accuracy. Studies that included only specific disease populations (eg, chronic renal failure or rheumatoid arthritis patients) were also excluded. We also excluded studies that considered the performance of single variables, such as weight or age. We accepted the definition of major osteoporotic (MOP) fracture adopted by each tool (see below).
Information sources
We only searched published articles. One reviewer (RJOF) performed the electronic search, piloted in PubMed MEDLINE (2003–2014) and then adapted to run also in Cochrane (2003–2014) and Embase (2003–2014). The last search was run on 28 February 2014, with monthly automatic email updates until 6 September 2014. We supplemented electronic searches by checking references cited in published SR and in the articles extracted from the electronic searches. Conference abstracts and unpublished studies were not searched.
Search and study selection
The search strategies included free terms and medical descriptors (eg, MeSH terms) for each PICOD synonym. Some terms used were: Osteoporosis, ‘Osteoporotic fractures’, ‘Risk Assessment’, Algorithms, ‘Area Under Curve’, ‘Sensitivity and Specificity’, ‘Validation Studies’ and ‘Cohort Studies’. The complete electronic string used for PubMed is provided in online supplementary table S1.
The following limits were applied: (a) articles published after 2003 (as no such studies had been published before then); (b) written in English, Spanish, French, Italian or Portuguese; and (c) performed in humans.
Studies were screened for inclusion over three phases, using Endnote software: (a) we searched and deleted duplicates; (b) two authors (AM and RJOF) independently assessed the electronic search results. They first screened by title and then by abstract. When a title seemed relevant, the abstract was reviewed for eligibility; (3) if any doubt remained, the full text of the article was retrieved and discussed. Arbitration by a third author (JAPS), applied in case of persistent disagreement, took place in two cases. The reason for exclusion was recorded after the full text screening. The inter-rater agreement between AM and RJOF for selection based on title, abstract and full text, measured with the κ statistic, was 0.99, 0.90 and 0.98, respectively.
The meta-analysis only included articles satisfying, cumulatively, the following four criteria: (a) only validation studies were considered (not the derivation models of the tool); (b) the tool had been validated for the country where the study was performed; (c) the tool had been validated for the outcome of the study (eg, studies employing in the prediction of vertebral fractures, a tool that had only been validated to predict hip fractures, were excluded); and (d) data were reported on at least 100 fracture events (as recommended by Vergouwe et al27).
Data collection
All the field researchers (AM, RJOF, ES, EL, LC and JAPS) validated the data extraction form, which was pilot-tested for feasibility and comprehensiveness with five studies and submitted to consensual minor adjustments. The data were extracted by one author (AM) into a Microsoft Excel spreadsheet. Data included the general characteristics of each study and the outcomes measured. A second author (RJOF) confirmed all the data extracted. We contacted some authors in order to obtain additional information, namely regarding required outcome statistical data (CIs and/or SE of AUCs).
Data items
We collected information on the following: (a) study (authors, year, country); (b) methods (study design, inclusion and exclusion criteria, tool(s) evaluated, factors/variables included in the fracture risk estimation, duration of follow-up, adjustment for time of follow-up, number of participants at the start and at the end of follow-up, reasons for loss to follow-up); (c) participants’ characteristics (age, sex, race, diseases, medication); (d) fracture characteristics (number per site, ascertainment methods); and (e) outcome results for (i) all fractures, (ii) major fractures and (iii) hip fractures (AUC and SE or 95% CIs).
Risk of bias in individual studies
The quality of each study was independently appraised by two investigators (AM and RJOF) using the Quality Assessment Tool for Diagnostic Accuracy Studies (QUADAS-2) checklist,28 and disagreements were solved by a third researcher (JAPS). We excluded some of the optional items of this checklist and added some new ones, as recommended by QUADAS authors29 and described by other groups.20 This resulted in a total of 14 items, all graded as adequate, inadequate or unclear (see online supplementary table S2). This quality assessment was not used to include/exclude data for meta-analysis, except for item 19, which refers to a minimum of 100 events of interest.
Summary measures and synthesis of results
For the synthesis of results, data were pooled and meta-analysis performed using Stata V.12 software (StataCorp, 2011). All results derived from primary studies (AUC and SE) were subjected to double data entry and the pooled AUC with 95% CIs were obtained from random effect meta-analyses by instrument type, fracture site, sex, and whether BMD was included or not.
To test heterogeneity among the studies, the I2 of Higgins and Thompson was calculated. An I² value close to 0% indicates no heterogeneity between studies, close to 25% indicates low heterogeneity, close to 50% indicates moderate heterogeneity, and close to 75% indicates high heterogeneity.30 ,31
Results
We included a total of 45 articles, evaluating 13 different tools. Figure 1 shows the study flow-chart. We identified 3546 articles from PubMed MEDLINE, 571 from Embase and 928 from Cochrane, and selected 60 for detailed review, of which 30 were excluded: 15 did not assess fracture risk prediction tools, 12 did not provide information regarding osteoporotic fracture outcome and 3 were SRs. We identified 15 additional articles through hand searching (n=13) and through saved search email updates (n=2). A total of 45 articles were finally included.

Flow-chart of the article selection.
The main characteristics of the 13 tools identified are presented in table 1. The number of factors required for calculation varies from 4 in FRAMO to 31 in the updated QFracture (2012) (see online supplementary table S3). Seven tools include BMD as a risk factor (two as an optional item). Seven tools only predict fracture risk for women. Some tools are available on the internet, the algorithm's formula is published in the article for others, and some are available only on request from the authors. The age range of valid prediction is variable: limited to the interval of 70 to 100 years in FRAMO, to 30 to 99 years in updated QFracture (2012). Most tools were developed for populations above 40–50 years of age. Regarding the time-horizon of prediction, most tools calculate a 5-year (n=7) or a 10-year risk (n=7). Fracture and Immobilization Score (FRISC) and the updated QFracture (2012) allow the shortest time of prediction (1 year) while some tools provide more than one time-interval, like FRISC with four time-points (1, 3, 5 and 10 years) and the updated QFracture (2012) with 10 time-points (1–10 years). Regarding the types of fracture that is individually predicted, 10 of the 13 tools predict hip fractures and 7 predict major or any osteoporotic fractures. The definition of MOP fracture differs between tools. FRAX considers MOP as the combination of hip, clinical spine, wrist, and humerus.32 The definition of the updated QFracture is similar, but all vertebral fractures are included, not only the clinical ones.33 GARVAN's definition of MOP fracture includes all those considered by FRAX plus distal femur, proximal tibia/fibula, distal tibia/fibula, patella, pelvis, rib, sternum, hands and feet (excluding digits).34
Characteristics of the fracture risk prediction tools
In addition, FRAMO predicts the mortality risk, and FRISC the immobilisation risk. The ‘Computer model for osteoporotic fracture risk’ tool provides an estimation of risk reduction after osteoporosis treatment. Finally, regarding the number of published studies assessing each tool, FRAX (with 26 studies in 9 countries), GARVAN (also known as GRX, 6 studies in 3 countries) and QFracture (3 studies in the UK, 1 including Irish participants) are the most extensively studied. All other tools have been evaluated by only one or two studies.
Methodological quality of the studies
A complete assessment of the quality of the 45 studies, using QUADAS-2, as well as a direct comparison between FRAX, QFracture and GARVAN studies, may be found in online supplementary figures S1 and S2.
Online supplementary table S4 shows the main characteristics of the 45 included articles. Thirty-five of the studies had a longitudinal prospective design, eight a longitudinal retrospective and one a cross-sectional.66 We also included a randomised controlled trial (RCT).43 The mean time of follow-up in the prospective cohorts ranged from 236 ,37 ,54 to 13.4 years76 and from 1.755 to 11 years (median)60 in the retrospective cohorts. Five studies evaluated two different tools, and most of them were conducted in North America, Scandinavian, Western Europe, Australia or Japan. Only two studies were multinational. The exclusion criteria were not described in 10 studies and were only briefly mentioned in many others. Only one study stated that no exclusion criteria were applied. The most common exclusion criteria were: unable to walk, use of corticosteroids, bisphosphonates or other bone-active agents, previous history of hip or MOP fractures, hip replacement and secondary osteoporosis. Participants were mainly recruited from the general population (n=22), but also from osteoporosis screenings (n=12), or were post-menopausal women (n=9). Concerning the total population at baseline, only one study33 provides this number for both the derivation and validation models, while 14 studies do not provide the baseline numbers, even for the validation model. This number varies from 39037 to over 1 m.33 All articles provide the number of participants available for event verification. The majority of studies included only women (n=30), while two studies included only men.45 ,64 The participant's age in the validation model ranged from 3033 to 116 years.32 The numbers of fractures were usually given for hip and/or MOP fracture, but other sites and other specific outcomes were presented according to the tool (eg, immobilisation)65 or specific aims of the study (eg, in obese and non-obese subjects).62 Diagnosis of fractures was based principally on self-report, confirmed by X-rays in 35 studies, or medical records/hospital discharge registers. The highest performances (AUC) were reported for FRAX in China41 (HipWomen with BMD=0.88; HipWomen without BMD=0.89) and for the updated QFracture71 (HipWomen=0.89; HipMen=0.88). The lowest AUCs (FRAXMen; US; MOP=0.54; FRAXMen; UK; MOP=0.57) were reported in a retrospective study using a FRAX model which had not been validated for that country and with a very small population.55
Meta-analysis
A total of 20 articles were selected for the meta-analysis. The reasons for exclusions are described in online supplementary table S5, the most relevant being number of fractures <100 and AUCs provided only for specific subgroups, for example, as defined by economic status. FRAX provides the greatest specification of outcomes: per site, per gender, with/without BMD. All studies with GARVAN included BMD, while QFracture excludes this measurement. Thus, we performed 10 different meta-analyses for FRAX (15 studies), 3 for GARVAN (5 studies) and 4 for QFracture (3 studies; we did not include updated QFracture published in 2012 because it only had one external validation study). Regarding the total number of participants included in the meta-analyses, GARVAN had the lowest numbers, QFracture was in between and FRAX had the largest numbers. All meta-analyses showed high heterogeneity, with the exception of one for FRAX and one for GARVAN (moderate heterogeneity). The results of all meta-analyses are presented in table 2. Overall, QFracture obtained the highest AUCs, being above 0.80 in three out of four studies. The three meta-analyses of GARVAN resulted in AUCs of around 0.70. Meta-analyses of studies with FRAX resulted in AUCs of between 0.61 and 0.79.
Meta-analyses of fracture risk assessment tools according to outcome specifications
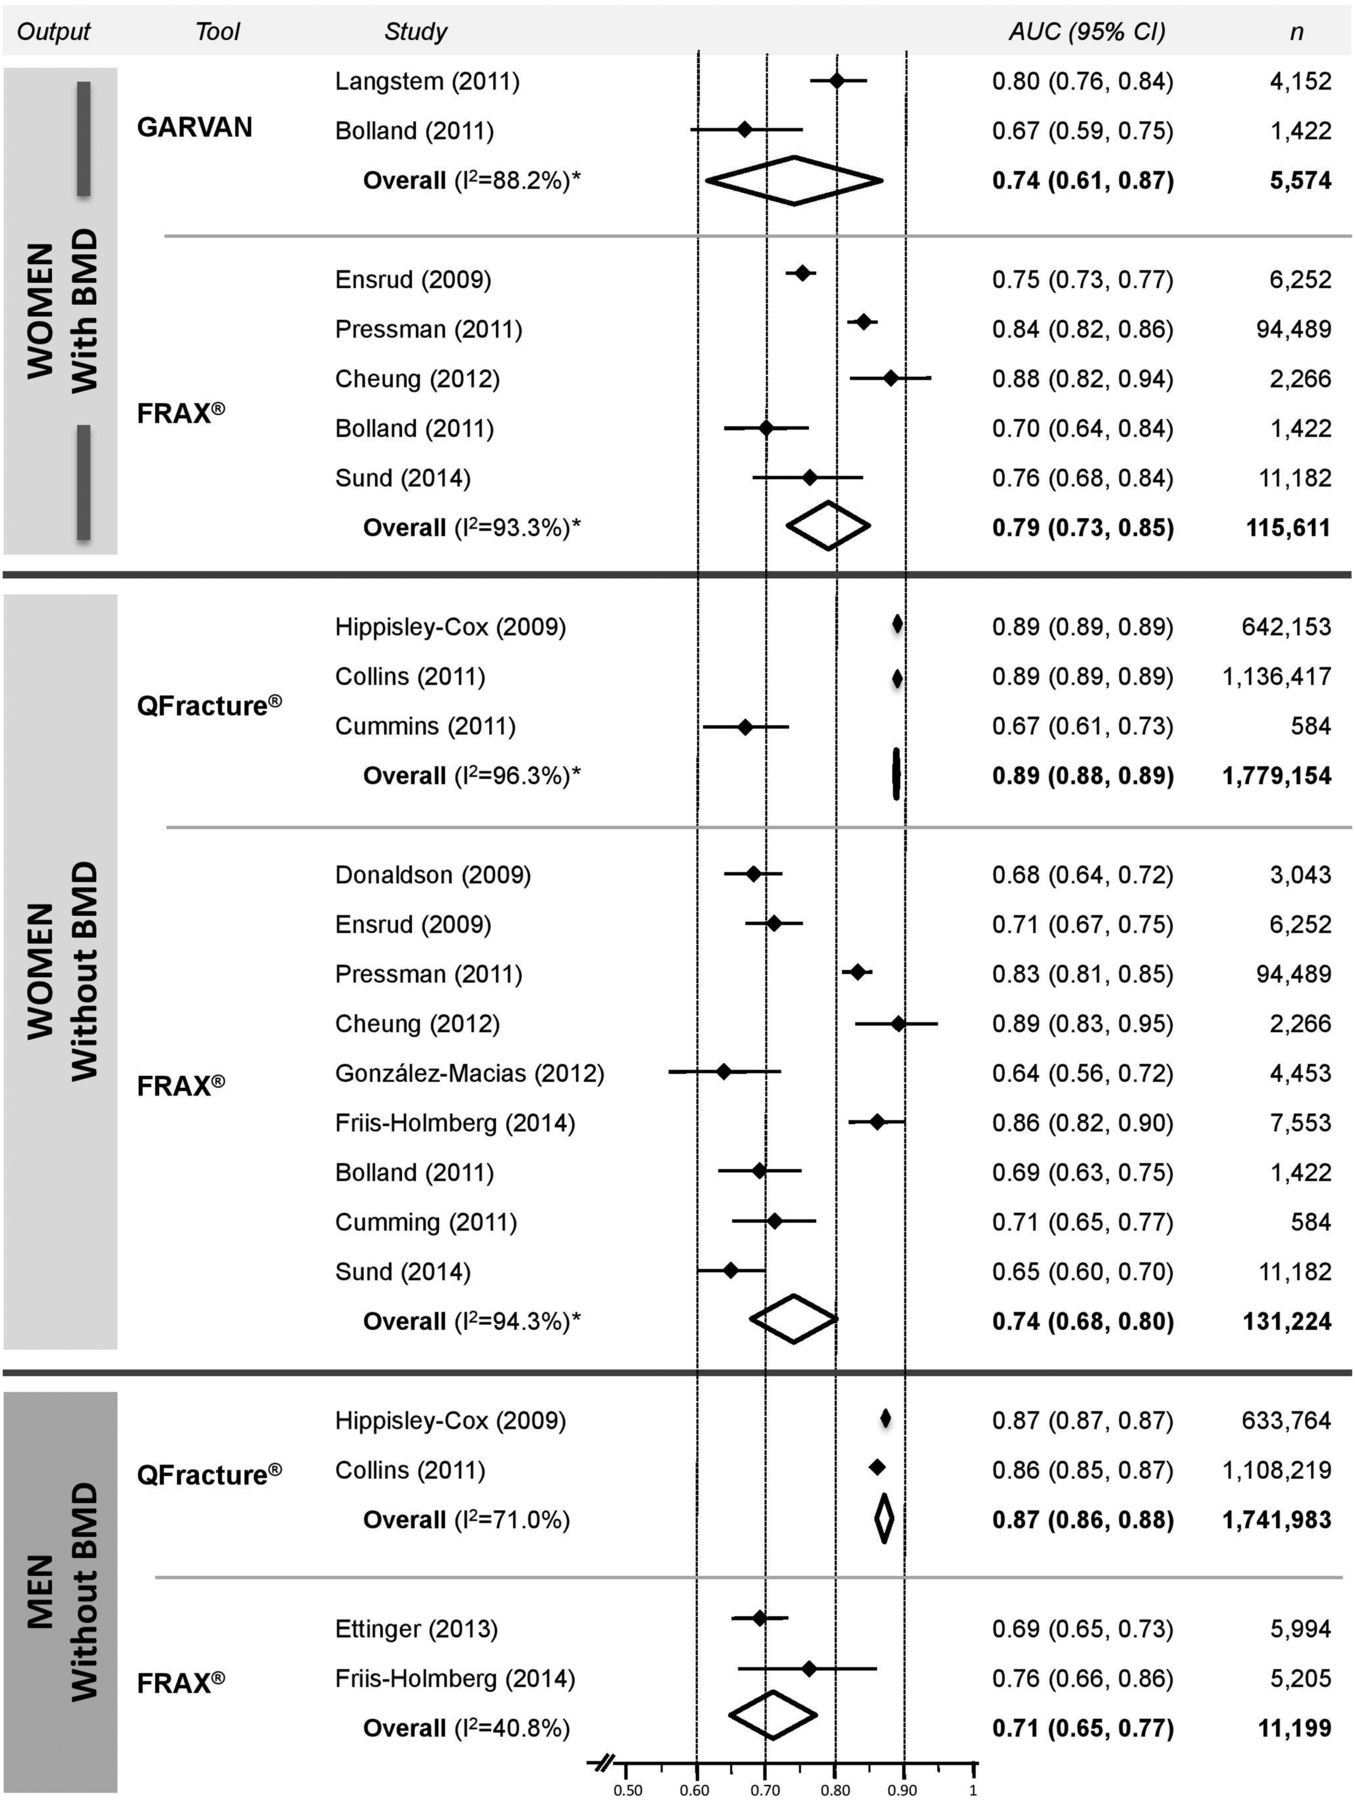
Pooled AUC data regarding hip fractures are presented in figure 2. This cannot be done for MOP fracture as the definition differs between the three tools.

FRAX, GARVAN and QFracture pooled areas under the curve (AUCs) (95% CI) for 10-year hip fracture prediction, according to sex and bone mineral density (BMD) input.
We compared the risk prediction accuracy of excluded against included studies with meta analysis and found statistically significant higher AUC in the former studies (data not shown).
Summary appraisal of tools
In table 3 we compare aspects of the three different tools deemed relevant for their selection for clinical and research purposes. Most of these features have been mentioned above.
Summary features of the three most studied tools, as deemed relevant for the selection of the instrument in clinical and research settings
The countries and contexts in which these three major tools have been tested differ considerably. FRAX has been used to evaluate risk of fracture and death in 57 countries and has been the subject of 26 different validation studies in 9 countries. GARVAN was tested only in Australia, New Zealand and Canada. However, it has been proposed that this instrument does not require incorporation of national fracture data.34 ,69 QFracture was only validated in the UK (with 88 participants from another country, Ireland, included) but by independent research teams; however, conversely, it has the largest number of participants.
QFracture is associated with the highest AUC, this being achieved at the cost of greater complexity and lower feasibility, given the large number of risk factors considered.
Discussion
This SR identified 13 tools for osteoporotic fracture risk prediction, adding one new instrument (FRISK)66 ,67 to the algorithms identified by previous SRs,20–23 and updating the validation information regarding those already identified. This will help clinicians and researchers select those that best apply to their setting and needs. We have also performed a meta-analysis for 10-year risk prediction of hip and MOP fractures with FRAX, GARVAN and QFracture (for men, women and both genders, with and without BMD). To the best of our knowledge, this is the first meta-analysis on this topic.
The differences between the currently available fracture prediction tools must be emphasized, as caution is required when comparing the results obtained with different instruments. The number of risk factors considered (which varies between 4 and 31), as well as their nature, will have an important impact on feasibility. Differences in output (sex, age, types of fractures and time-intervals of prediction) might affect the applicability of the tool. All instruments predict the risk of osteoporotic fractures but not all provide separate estimations for hip and for major fractures.
On the other hand, our quality assessment of the included studies reveals, as with previous evaluations,20–23 significant pitfalls in most of the studies, although recent publications appear to be of better quality.45 ,47 Among the most important drawbacks is the lack of certainty of unbiased recruitment from the target population.
There is also a lack of correspondence between the spectrum of participants and the population expected to receive the test in daily practice. This problem was observed in about 50% of included studies and in about 50% of the reports of the three major tools. All the instruments were validated for the general population, but several studies recruited participants from osteoporosis screening settings,38 ,40 ,42 ,50–52 ,55 ,60 ,63 ,72 ,73 while some explicitly excluded people treated for osteoporosis.41 ,42 ,53 ,55 ,56 ,58 ,63 Reports, unfortunately, do not provide the detailed data necessary for assessing the potential impact of treatment upon fracture prediction. We also verified that two studies excluded individuals previously exposed to glucocorticoids,42 ,43 even though this risk factor was included in the risk algorithm under evaluation.
Follow-up time was consistent with the time-horizon of prediction validated for the tool in only a third of the studies. Furthermore, most of those without the required follow-up time32 ,33 ,40 ,41 ,43–45 ,47–50 ,53–55 ,61 ,62 ,65 ,68 ,70 ,71 did not perform any statistical adjustments for this, which may have influenced the estimated AUCs.
Attrition is a well-known problem in longitudinal epidemiological studies.77 The attrition rates vary considerably between the included studies, and most of them did not explain these rates. Death is a common cause of attrition in cohort studies of older people,78 which affects the accuracy of the models. Only some studies in this SR took this into account.39 ,41 ,45 ,47 ,48 ,57 ,58 ,61 ,62 ,64 One study38 excluded women who died during follow-up, even though fracture, or its complications, might have been the cause of death.
For practical reasons we will focus our discussion below on FRAX, QFracture and GARVAN, as only these tools have been the subject of more than two validation studies testing exactly the same algorithm. FRISC has three validation studies, but each of them considered a different number of risk factors.
FRAX, GARVAN and QFracture can differentially predict risk in men and women and estimate the risk for hip and MOP fracture. However, the definition of the latter is different in each tool, thus precluding direct comparison.
QFracture and updated QFracture (2012) include a larger number and wider variety of clinical risk factors than FRAX and GARVAN. It is likely that algorithms with the longest lists of risk factors will have feasibility and adherence problems, but also greater accuracy. On the other hand, shorter lists may decrease the accuracy of the prediction. In some studies, the authors excluded some of required risk factors, which inevitably weakens the robustness of the prediction, even if the impact upon the AUC and c-statistic is typically small.79 ,80 In fact, even strong risk factors will have a minimal impact on the AUC if their prevalence in the studied population is low. This may be mistakenly reassuring and, as a rule, prediction tools should be used in strict accordance with the instructions provided by the authors, which in turn reflect the conditions of validation. There are, therefore, several potential caveats in the conclusion that deleting risk factors or opting for simpler ones is a good choice on the basis of the AUC alone.81
In FRAX, fracture probability is computed taking both the risk of fracture and the risk of death into account. Neither GARVAN nor QFracture include mortality. Kanis et al81 have shown that this induces an inadequate continuous increase in the risk predicted by GARVAN in very advanced age. It is possible that the same may happen with QFracture.
Accuracy of estimates
Comparing instruments based on their AUCs, we found important pitfalls related, first and foremost, to differences in the definitions of events and to the participants’ characteristics.81 AUCs also tend to be smaller, the narrower the age range and the longer the duration of follow-up.81
To avoid these pitfalls we have: (a) appraised the quality of studies; (b) excluded the original studies, that is, derivation models from meta-analysis; and (c) restricted the comparative analysis to minimally comparable data (hip fractures).
We found that the meta-analysis of studies indicates higher AUCs with QFracture (0.89 and 0.87) than FRAX (0.74 and 0.71) when comparable data are available: hip fractures in women and men, respectively, both without BMD. The 95% CIs in the main two studies and the overall results of QFracture are practically residual and much smaller than those observed for FRAX (0.68 to 0.80 and 0.65 to 0.77), which reflects the larger number of participants in the QFracture studies. QFracture was designed for integration into electronic records systems where all necessary data have already been collected as part of routine care, as in the clinical research databases that served to derive and validate the model. The tool is incorporated into the electronic system allowing automatic calculation. The setting is very convenient but extremely hard to reproduce elsewhere. Derivation and validation were performed in different population samples, but from the same country, which favours a higher AUC. The fact that the tool amenable to meta-analysis (QFracture 2009) is no longer available adds to these difficulties.
Adding BMD to FRAX increases the AUC from 0.74 to 0.79 in women, and from 0.71 to 0.77 in men, but this is still below the values achieved with QFracture (0.89 and 0.87, respectively). Comparing the meta-analysis for GARVAN and FRAX, is only possible for hip fractures in women, using BMD—the results indicate a small numerical advantage for FRAX.
The performance of all these tools was validated for the general population. Thus, their application for specific settings (eg, osteoporosis population, secondary causes of osteoporosis) implies a risk of error. Further studies should also evaluate the threshold for use in clinical practice. Comparison between tools should, ideally, be made in the same population.
Limitations and strengths of this study
Assessing the quality of the studies with QUADAS-2 proved a difficult task, mostly due to poor reporting, and may be controversial as regards some points.
Concerning the meta-analysis, we frequently had to calculate the SE based on other parameters, which may have led to slightly different results (at a centesimal level).
We did not ask authors to provide data on age when this was missing from the publications. This may have slightly influenced the results of meta-analysis, as age may affect the AUC.81 The only way to adjust our meta-analyses by age was to include studies with similar age bands or to stratify. We did the first but not the second as it was not possible to stratify with the published data.
Using AUC as the outcome for the meta-analysis could also be seen as a limitation, given its weaknesses as discussed above. Furthermore, given that fracture rates differ significantly from country to country, comparison of data obtained in different countries involves some risk of error. However, the vast majority of studies only provide these data.
Among the strengths of this study we would emphasise the comprehensiveness of the literature search and appraisal. Although we did not include so-called ‘grey literature’ (ie, congress abstracts and unpublished data), the hand search gives us a high degree of confidence that no major studies were missed. No study was excluded for language reasons. We limited our meta-analyses to sets of data that we found to be valid and directly comparable, thus avoiding most of the potential errors in similar exercises. Because we recognised significant heterogeneity, the analyses were performed using the random effects model,30 ,31 ,82 which assumes that the effect of interest is not the same in all studies. This is a more conservative approach, resulting in wider 95% CIs, while, hopefully, reducing the risk of unrealistic assumptions.30 This was the first meta-analysis performed on data from fracture risk prediction tools.
Conclusions
Thirteen externally validated algorithms designed to predict osteoporotic fracture risk are currently available to clinicians and researchers. Most of these tools are feasible in clinical practice and are simple to access and use. FRAX, QFracture and GARVAN are the most extensively studied tools, with FRAX having the greatest number of independent studies. FRAX was evaluated in a larger number of countries and also allows finer specification of outcomes. Adding BMD to FRAX increases the AUC for hip fractures in both men and women. Studies with QFracture present the highest AUCs; however, this tool has only been studied in the UK and Ireland and requires consideration of 19 clinical factors. This number was actually increased to 31 in the updated version, with a marginal increase in accuracy.
Methodological limitations and risk of bias are present in most studies, but to a lower extent than in the oldest studies. High-quality studies to assess the calibration of fracture prediction tools are still needed. Researchers should use the instruments in accordance with the requirements and indications for which they were validated, in order to allow international unbiased comparisons and better quantitative synthesis.
Acknowledgments
The authors thank John Kanis, Julia Hippisley-Cox and Tuan V. Nguyen, the main authors of the FRAX, QFracture and GARVAN studies, respectively, for critical review of this article and constructive comments. They also would like to thank the researchers who kindly provided additional, unpublished data from their studies: Bruce Ettinger, Gary S. Collins, John Kanis, Lisa Langsetmo and Niamh Cummins.
References
Supplementary materials
Supplementary Data
This web only file has been produced by the BMJ Publishing Group from an electronic file supplied by the author(s) and has not been edited for content.
- Data supplement 1 - Online figures
- Data supplement 2 - Online table S1
- Data supplement 3 - Online table S2
- Data supplement 4 - Online table S3
- Data supplement 5 - Online table S4
- Data supplement 6 - Online table S5
Lay summary
This web only file has been produced by the BMJ Publishing Group from an electronic file supplied by the author(s) and has not been edited for content.
Footnotes
Handling editor Tore K Kvien
Contributors All authors of this research paper have directly participated in the planning, execution, or analysis of this study; have read and approved the final version submitted and gave the necessary attention to ensure the integrity of the work.
Funding AM was supported for this study by an educational grant from the Portuguese Health Directorate.
Competing interests AM and JAPS were involved in validation of the FRAX algorithm for the Portuguese population.
Provenance and peer review Not commissioned; externally peer reviewed.