Article Text

Abstract
Objective Osteoarthritis (OA) and osteoporosis are often considered to lie at opposite ends of a spectrum of bone phenotypes. Lumbar degenerative disc disease (LDD) may be associated with low back pain (LBP) and is similar in many ways to OA. LDD is reported in small studies to be associated with increased spine bone mineral density (BMD). The present work aimed to confirm this association in a large population sample using MRI and explore the relationship further, in particular to determine whether it is mediated genetically.
Methods A population based sample (N=908, age range 32–74 years) of UK female twins having MRI of the lumbar spine was used in this study. LDD traits and summary measures and their relationship with BMD at the lumbar spine and hip were examined using multivariate multiple regression and maximum likelihood based variance decomposition.
Results There was a significant positive correlation between LDD and BMD at the lumbar spine and hip, which remained significant after adjustment for confounders. Both traits were highly heritable and the associations between them were mediated genetically.
Conclusions A clear, significant and independent association of BMD at hip and lumbar spine with LDD was found which is, in part, genetically mediated. The association with the non-axial site, the hip, is of particular interest and suggests a systemic bone effect. This should encourage the search for pleiotropic genes to help in the understanding of the bone–cartilage relationship. Moreover, genetic variants identified could provide novel therapeutic targets in the management of LBP.
This paper is freely available online under the BMJ Journals unlocked scheme, see http://ard.bmj.com/info/unlocked.dtl
Statistics from Altmetric.com
Introduction
For some time osteoarthritis (OA) and osteoporosis (OP) have been considered by many to lie at opposite ends of the same bone phenotype spectrum. There is evidence of an inverse association between incident peripheral joint OA and OP from single generation and multigenerational studies: the effect was thought to be mediated by higher peak bone mass.1 However, our understanding of these conditions remains incomplete and somewhat conflicting: there are also data showing those with hip and knee OA have higher bone loss.2 3 Lumbar degenerative disc disease (LDD) as defined radiologically is a normal feature of the ageing spine and has many of the features of peripheral joint radiographic OA. Some research has examined the relationship between disc morphology and OP4,–,6 but data remain scarce. The situation is complicated by the involvement of risk factors including age, sex, body weight, smoking, physical exercise and occupation that may influence OA-related and OP-related phenotypes. Although many studies agree on the significance of such risk factors, the quantitative effect of the majority of them has been found to be very small, even insignificant.7,–,9 However, there is a well established major genetic component underlying variation in LDD10,–,12 and bone mineral density (BMD).13,–,15 It may be that people who develop OA/LDD have an underlying predisposition to increased BMD at all skeletal sites. To answer these questions, we examined the association between MRI-determined LDD and BMD assessed at the lumbar spine and hip in a large community based sample of UK female twins.
Patients and methods
Study sample
A total of 2256 from a volunteer-based group of healthy Caucasian women (age range 18–84) were examined in this project, comprising 378 and 716 pairs of monozygotic (MZ) and dizygotic (DZ) twins (having, for funding reasons, varying degrees of phenotyping). This sample represents a part of an adult female twin cohort recruited to the TwinsUK register over a number of years (http://www.twinsuk.ac.uk) from the general UK population16 and a subset has been included in previous studies of LDD10 and low back pain.17 Ethics committee approval was obtained and the participants gave informed consent.
MRI assessment
A total of 908 women were examined for the extent of LDD using MRI conducted in the morning in supine position as described previously.10 These included 282 DZ and 138 MZ pairs and 68 single individuals. MRI was performed using a Siemens (Munich, Germany) 1.0-tesla superconducting magnet between 1998 and 2001. Serial T2-weighted sagittal images of the thoracolumbar junction and lumbar spine (T9-L5) were obtained as described in detail previously.10 The four main traits were scored 0–3 as previously: disc signal intensity within the nucleus pulposus, disc height measured in the middle of the disc, lumbar disc extension into the spinal canal and anterior osteophytes using the five middle slices of the sagittal scan. Each trait was summarised over the five lumbar discs and the traits summed to give the LDD summary score, which reflected the extent of the lumbar spine degeneration. In other words, the higher the score the more severely the spine affected.
Assessment of BMD at spine and hip
As part of ongoing studies within the department, twins had attended for dual energy x-ray absorptiometry (DXA) of the lumbar spine (L1–4) and hip using the Hologic QDR2000 (Hologic, Bedford, Massachusetts, USA) method, as reported elsewhere previously.15
Other risk factors
In addition to age, the following covariates were examined: body weight, height and body mass index (BMI), smoking (pack years), manual work and physical exercise. Manual work was defined as time spent doing manual work: including digging or shovelling, driving a lorry, tractor or digger, using vibrating machinery, lifting or moving weights of approximately ≥25 kg by hand. Physical exercise was defined by responding to the question ‘Have you done any regular sporting activity at any time since you left school?’ affirmatively.
Statistical and genetic analysis
The analysis of the data was carried out in two sequential stages. The first stage included testing the association of various risk factors including BMD with LDD scores variation. At this stage, we were interested in clarification of the association between the potential covariates available to this study (eg, age, physical exercise, body weight, BMD and others) and our variable of interest. This first involved a simple correlation analysis (or analysis of variance for categorical traits) between each covariate and LDD. Since the variation of the examined covariates was not independent from one another (eg, age and BMD, weight and BMD, etc) to choose those variables which can be significantly and independently associated with LDD we used next a multivariate technique of analysis, that included multivariate multiple regression analysis to test simultaneously the significance of the multiple predictors (eg, age, weight and BMD) on multiple dependent variables (eg, disc height, osteophytes, etc). The major advantage of this technique in comparison to a more frequently used multiple regression analysis is that it takes into account correlation between the predictor variables and between the dependent variables and thus reduces multiple testing. These statistical analyses were conducted using the Statistica V.7.1 package for Windows (Statsoft, Tulsa, Oklahoma, USA).
At the second stage of analysis, we conducted analysis of LDD variation and its covariation with BMD variables. Evaluation of the degree of the contribution of common genetic factors (genetic correlation (RG)) to correlation of LDD and BMD was carried out simultaneously controlling for the effects of other covariates. To achieve this aim we used variance component analysis as implemented in statistical package MAN-9.18 The main aim of this analysis was to estimate simultaneously contribution of the potential covariates identified in the first stage (eg, age, weight, etc) and genetic factors to interindividual differences in the extent of LDD. This method enables estimation of the contribution of different independent components to variation of the trait, including additive genetic effect Vad, potential common family environment VCM, as well as the effect of covariates such as age and weight. The method is described in detail elsewhere.19,–,21
Since there were significant correlations between LDD summary score and its component traits (unsurprisingly) as well as between them and BMD measurements, we used bivariate variance component analysis to evaluate the extent of the common genetic and environmental effects on variation and covariation of each pair of traits, simultaneously estimating effect of the potential covariates (eg, age and weight) on each dependent variable. The extent of the shared (pleiotropic) genetic factors was assessed by an additive RG and the contribution of shared environmental factors by an environmental correlation (RE).19
Results
Sample characteristics are shown in table 1 with data available, depending on phenotype, for between 898 and 2256 individual twins. The LDD summary score was normally distributed so was treated as a quantitative trait. The mean age of the twins was 50.3 years with a wide range (18.7–85.0 years). The mean BMI of the twins was 25.0 kg/m2 (range 18.4–38.6, within 99% of the distribution) showing a considerable range in body mass. Most twins had some degenerative disc findings on MRI scan. The main finding of the study is illustrated in figure 1 (BMD vs LDD) where the BMD measure is shown split into quintiles. There was a clear relationship between LDD and BMD at the hip and lumbar spine. Increasing disc disease was found associated with higher BMD at hip and lumbar spine (p<0.0001 for each) across the range of BMD measurements (table 1).

Age-adjusted lumbar degenerative disc disease (LDD) summary score (mean±SE) by (A) lumbar spine bone mineral density (BMD) and (B) hip BMD. BMD categories 1 to 5 correspond to values in the ranges: <−1.5 SD, 1.5 SD to −0.5 SD, −0.5 SD to 0.5 SD, 0.5 SD to –1.5 SD and >1.5 SD, respectively. (A) Regression coefficient, b=0.24±0.03, p<0.0001, N=877. (B) Regression coefficient, b=0.18±0.03, p<0.0001, N=890.
Basic descriptive statistics of the UK Twins sample showing available sample size for each phenotype
Preliminary analysis of LDD traits and LDD summary score showed significant correlations with age, weight and exercise, lumbar spine BMD and hip BMD (table 2, third column for each covariate, unadjusted R) and linear regression coefficients with BMD confirmed continuous and consistent increase of BMD measures as LDD increases (figure 1). The multivariate multiple regression analysis showed highly significant association (overall p<0.001) of the LDD and its structural components with age, lumbar spine BMD (as well as with hip BMD, not shown), body weight and exercise. However, contribution of the specific risk factors to each of the dependent variables variation, as measured by R2 increment (first column for each covariate, table 2), was not equal and not consistently significant for all (table 2). The analysis confirmed age and lumbar spine BMD (and hip BMD, data not shown) to be significant independent predictors for all LDD traits including LDD summary score, each with overall p<0.0001. The magnitude of the effect (R2 increment) of the BMD was more substantial and consistent even than the effects of weight and exercise. Thus, for example, lumbar spine BMD independently contributed 3% to disc height variation, while weight and exercise only approximately 0.5%, each (table 2). Body weight and exercise were significantly associated with some but not all the LDD components.
LDD traits and summary score with risk factors: multivariate multiple regression analysis (for entire model, multiple p<0.0001)
Contribution of genetic factors
Next, we examined the contribution of genetic factors to LDD traits and summary score as well as covariation between LDD and BMD. The detailed results of this analysis are provided in the supplementary material. All the LDD traits displayed a significant and substantial genetic component, with heritability estimates of 37.7% ± 4.48% (disc signal intensity) to 58.0% ± 5.34% (disc height). None of the traits was significantly influenced by shared environmental factors present in a household. The remaining phenotypic variability not accounted for by family effects was attributable to age and weight as well as to individual specific random environmental effects. As in multivariate multiple regression analysis, an effect of age was seen to be significant for all variables. Contribution of weight was modest but significant for all variables, except anterior osteophytes. Our analysis also showed strong and significant RG between LDD traits and summary score (see supplementary material), ranging between 0.69±0.03 (LDD and osteophytes) and 0.89±0.02 (LDD and disc height), as well as an RG between the LDD traits themselves (see supplementary material, RG varied between 0.36±0.10, disc signal/osteophytes and 0.78±0.09, disc bulge/osteophytes).
RG between LDD and BMD
The last hypothesis, of pleiotropic genetic effects on disc degeneration and BMD, was tested using bivariate variance component analysis of LDD and BMD at lumbar spine and hip, with simultaneous adjustment for age, weight and exercise (table 3). In testing association with lumbar spine BMD, we found that phenotypic correlation observed between these two traits is attributable to common genes (RG=0.232±0.050) and shared environmental factors (RE=0.205±0.074), p<0.005 by likelihood ratio test. The bivariate analysis involving hip BMD confirmed significant involvement of common genes (RG=0.137±0.049), but no contribution of shared environmental factors was detected at the hip.
Bivariate variance component analysis of LDD summary score with lumbar spine BMD with simultaneous adjustment for covariates
Discussion
These findings are not simply of academic interest to bone biologists. Back pain is a costly problem in Europe, in terms of doctor visits and work absenteeism. Understanding the genetic relationship between LDD and BMD—direct and indirect causes of back pain—will lead to better understanding of cellular pathways and mechanisms. This investigation of a large sample of female twins has confirmed a highly significant association between BMD and LDD, which remained significant after adjustment for other significant covariates (age, weight, exercise). That is, we found that the individuals with more advanced degenerative changes in lumbar spine tended to have higher BMD in spine and hip. Component traits of MRI-determined LDD (disc height, disc signal, anterior osteophytes and disc bulge) were examined individually: association with lumbar spine BMD was identified for all of them (table 2), particularly disc height. It has been thought, particularly by clinicians performing regular DXA scans for clinical monitoring of OP, that osteophytes might account for spuriously high readings of BMD.22 23 However, the correlation between lumbar BMD and LDD cannot be explained by osteophytosis alone (correlation was not the highest with this trait and BMD correlated significantly with other LDD components), even taking the relationship with osteophytes into account (table 2).
A relationship between OA, specifically osteophyte development at various joints and BMD has been proposed previously.3 24 However, few have attempted to examine the relationship between degenerate discs and BMD, and those that have used plain radiography for LDD assessment and not the more sensitive imaging technique of MRI.5 25 For example, Pye and colleagues5 using a sample of 500 men and women examined osteophytes, disc space narrowing and endplate sclerosis at 4 lumbar discs with radiographs and showed that BMD increased with increasing grades for all radiographic features in both sexes. They concluded ‘our data support the hypothesis that degenerative disc disease is inversely linked with osteoporosis’. However, when they adjusted disc space narrowing score for age and BMI it remained significantly correlated with BMD at the spine, but not at the femoral neck. In the present study, correlations between LDD and disc height on the one hand and spine and hip BMD on the other remained significant before and after adjustment for covariates, confirming true association. The nature of this association, however, is not entirely clear. Does this represent a true increase in BMD or a spurious effect resulting from the remodelling of the intervertebral disc, with likely secondary changes in the vertebral endplate6? That hip BMD is elevated in LDD supports the hypothesis that BMD is systemically raised rather than just locally altered (figure 1). While we cannot totally discount early hip joint degenerative change influencing hip BMD, DXA measurements are conventionally made away from the joint margin making this explanation seem implausible.
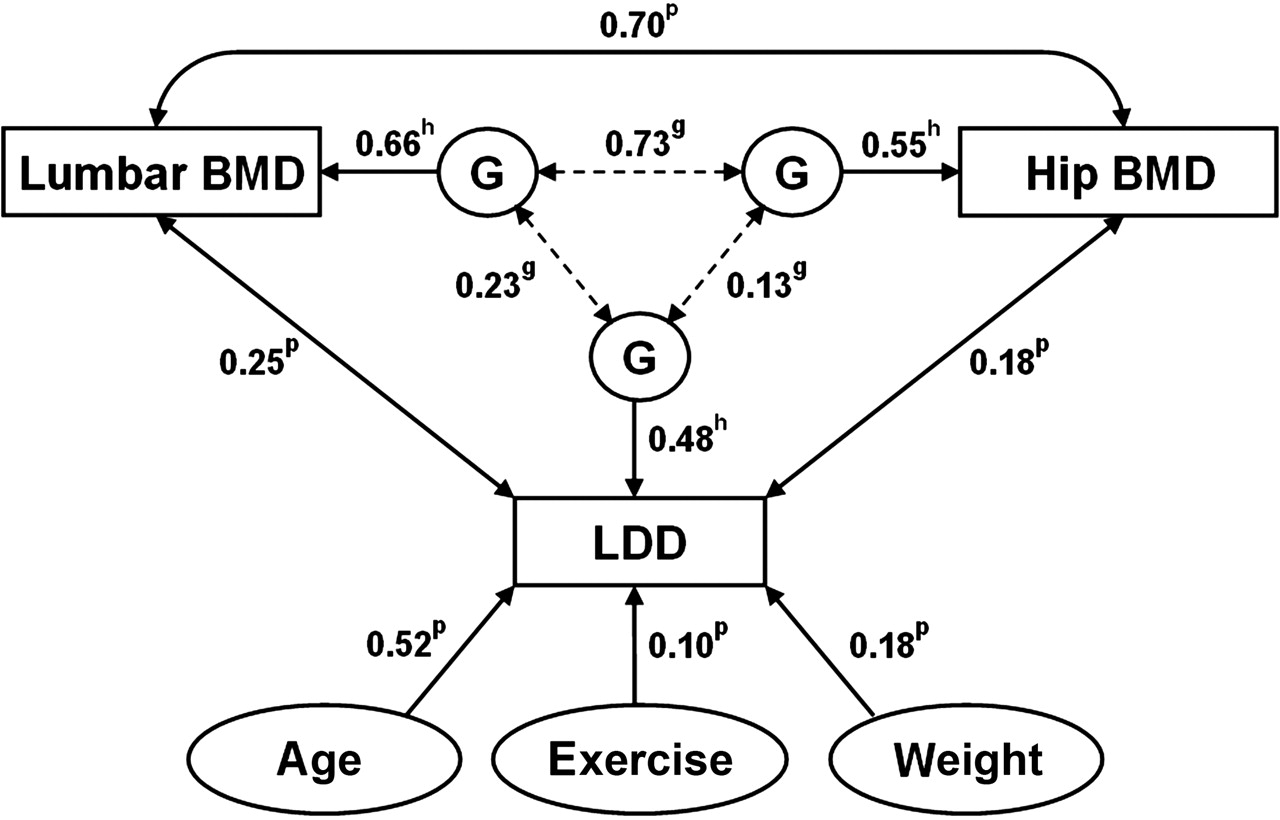
Analysis of the putative genetic effects on variation and covariation of LDD and BMD may shed light on the underlying mechanism. The relationships between LDD and both BMD variables are summarised in figure 2, which shows genetic heritability and RG estimates and other risk factors for LDD. The association between LDD and BMD is mediated, at least partially, by shared genetic factors, consistent with previously reported findings that peak bone mass is increased in the hip in daughters of women with OA.24 It is, of course, of great interest to identify molecular mechanisms causing such a correlation. We speculate that several metabolic pathways (independently or in combination) associated with subchondral bone metabolism may be involved. One might explore the tight balance between the levels of inorganic phosphate and extracellular pyrophosphate ions that is required for normal bone and cartilage mineralisation.26 27 In addition, subchondral bone tissue produces also a number of proinflammatory cytokines and growth factors that are involved in cartilage tissue remodelling and may cause initiation and/or progression of OA.28 It is clear, therefore, that further molecular genetic research is needed to elucidate specific mechanism(s) causing this correlation, as well as to explain LDD variation, which is not fully explained by known risk factors at present (figure 2).
Inter-relationships between lumbar degenerative disc disease (LDD), hip and spine bone mineral density (BMD) and other risk factors for LDD. The contribution of genetic factors (G) to variation of each dependent variable (labelled h, heritability) and to their pairwise covariation (g). The figure also shows phenotypic correlations (adjusted for age) between LDD and other variables, ‘p’. The figure is based mostly on data in tables 2 and 3.
One of the main limitations of this study is that it includes only women and the results may not be applicable to men. However, there is nothing to suggest that LDD differs greatly between the sexes, although women are thought to lag men temporally in their manifestation of LDD. Female twins in our sample do not, on the whole, have heavy manual occupations so we are not in a good position to study this occupational influence. Budget limitations meant that we could not obtain MRI on all our twins, but this still represents one of the largest population samples phenotyped for LDD using MRI. There are a number of advantages to our work. These include large sample size, all adult individuals but with wide age range: between 32 and 74 years, MZ and DZ twins of the same sex and most important potential covariates. These allowed us to model statistically and estimate simultaneously the magnitude of the association of various predictors with LDD, and avoid the sex covariate interaction common for this type of study. Qualitatively our results are in good agreement with previously published data on adults showing a significant contribution of the genetic factors to variation in LDD, regardless of imaging method.12 29
In conclusion, this cross-sectional study of a large sample of female twins confirms a consistent and highly significant association between LDD and BMD at the hip and lumbar spine. The association persists after taking other covariates into account and is true for all four MRI traits studied: disc height, disc signal, anterior osteophytes and disc bulge. Our findings are consistent with previous limited data and, of importance, they emphasise that this relationship cannot be attributed to local osteophyte formation. Molecular genetic identification of the specific mechanisms and genes affecting LDD components and OP is now required.
Acknowledgments
We would like to thank all the twins who participated in the study, staff in the Department of Twin Research and to acknowledge financial support from the Wellcome Trust, the Department of Health via the National Institute for Health Research (NIHR) comprehensive Biomedical Research Centre award to Guy's & St Thomas' NHS Foundation Trust in partnership with King's College London and the Arthritis Research Campaign. The study was also partially supported by, Israel Ministry of Health, Chief Scientist grant no. 3-4101.
References
Supplementary materials
Web Only Data ard.2010.131441
Files in this Data Supplement:
Footnotes
-
Funding The Wellcome Trust, the Arthritis Research Campaign, Israeli Ministry of Health Chief Scientist.
-
Competing Interests None.
-
Patient consent Obtained.
-
Ethics approval This study was conducted with the approval of the St Thomas' Hospital Research Ethics Committee.
-
Provenance and peer review Not commissioned; externally peer reviewed.