Article Text

Abstract
Objectives Diagnostic reasoning in systemic lupus erythematosus (SLE) is a complex process reflecting the probability of disease at a given timepoint against competing diagnoses. We applied machine learning in well-characterised patient data sets to develop an algorithm that can aid SLE diagnosis.
Methods From a discovery cohort of randomly selected 802 adults with SLE or control rheumatologic diseases, clinically selected panels of deconvoluted classification criteria and non-criteria features were analysed. Feature selection and model construction were done with Random Forests and Least Absolute Shrinkage and Selection Operator-logistic regression (LASSO-LR). The best model in 10-fold cross-validation was tested in a validation cohort (512 SLE, 143 disease controls).
Results A novel LASSO-LR model had the best performance and included 14 variably weighed features with thrombocytopenia/haemolytic anaemia, malar/maculopapular rash, proteinuria, low C3 and C4, antinuclear antibodies (ANA) and immunologic disorder being the strongest SLE predictors. Our model produced SLE risk probabilities (depending on the combination of features) correlating positively with disease severity and organ damage, and allowing the unbiased classification of a validation cohort into diagnostic certainty levels (unlikely, possible, likely, definitive SLE) based on the likelihood of SLE against other diagnoses. Operating the model as binary (lupus/not-lupus), we noted excellent accuracy (94.8%) for identifying SLE, and high sensitivity for early disease (93.8%), nephritis (97.9%), neuropsychiatric (91.8%) and severe lupus requiring immunosuppressives/biologics (96.4%). This was converted into a scoring system, whereby a score >7 has 94.2% accuracy.
Conclusions We have developed and validated an accurate, clinician-friendly algorithm based on classical disease features for early SLE diagnosis and treatment to improve patient outcomes.
- lupus erythematosus
- systemic
- autoantibodies
- autoimmune diseases
Data availability statement
Data are available upon reasonable request. Data will be available upon request.
This is an open access article distributed in accordance with the Creative Commons Attribution Non Commercial (CC BY-NC 4.0) license, which permits others to distribute, remix, adapt, build upon this work non-commercially, and license their derivative works on different terms, provided the original work is properly cited, appropriate credit is given, any changes made indicated, and the use is non-commercial. See: http://creativecommons.org/licenses/by-nc/4.0/.
Statistics from Altmetric.com
Key messages
What is already known about this subject?
Systemic lupus erythematosus (SLE) diagnosis often poses significant challenges especially at early stages and formal diagnostic criteria are currently missing.
What does this study add?
By the use of machine learning (Least Absolute Shrinkage and Selection Operator-logistic regression) training of well-defined features of SLE, including features that are not part of the classification criteria, derived from a large discovery cohort, we have developed a novel statistical model for SLE diagnosis.
The new model, including 14 variably weighed, standard clinical and serological features, can produce individualised SLE risk probabilities enabling the classification of a validation cohort into unlikely, possible, likely and definite SLE.
When treated as binary (ie, SLE or not SLE), the model shows excellent combination of sensitivity and specificity for SLE (including early and severe forms of the disease) against competing rheumatologic diseases.
The logistic regression model can be converted into a simple scoring system for both clinical and serological features, with an operational cut-off score of 7.
How might this impact on clinical practice?
Pending further validation in prospective studies, the new diagnostic model (SLE Risk Probability Index) can assist the early diagnosis and treatment of patients with SLE to improve disease outcomes.
Introduction
Diagnosis of systemic lupus erythematosus (SLE) can be challenging and delayed by several months or years,1–3 resulting in increased patient uncertainty, referrals and healthcare utilisation.4 Delays in diagnosis and treatment initiation have been linked to increased flares and organ dysfunction.4–6
SLE diagnosis often relies on the acumen of physicians and is typically elicited by the presence of ‘high-yield’ features or multiple, although less-specific findings. Due to absence of diagnostic criteria, classification criteria, developed to facilitate the inclusion of homogenous disease populations in clinical studies,7 are commonly used as a diagnostic aid. The Systemic Lupus International Collaborating Clinics (SLICC)8 and European League Against Rheumatism/American College of Rheumatology (EULAR/ACR)9 10 criteria enable the earlier classification of increased number of patients.11 Moreover, the EULAR/ACR 2019 criteria achieve the highest combination of sensitivity and specificity.9–11 Improved classification has not remedied the challenge for diagnosis especially at early stages.11 12
Artificial intelligence tools based on machine learning (ML) are increasingly used to manage difficult medical tasks. Such models can be trained from different kinds of medical or biological data.13 14 ML has been used for the molecular classification of inflammatory myositis15 and rheumatoid arthritis,16 for predicting mortality,17 response to biological agents18 and disease activity,19 whereas less effort has been directed towards diagnosis.20 21 Building robust computational models that avoid excess complexity represents an important challenge.14 22
Herein, we applied ML on panels of clinical features aiming to construct a model that can accurately detect SLE against competing rheumatologic conditions. We used a discovery cohort of patients with SLE or control diseases to train two standard ML algorithms, namely, the Random Forests (RF) the Least Absolute Shrinkage and Selection Operator (LASSO) followed by Logistic Regression (LR). RF is a non-linear method with high complexity and thus, less explainable, whereas the LR is a linear method supporting simpler, more clinically interpretable results.23 The best model selected by internal cross-validation (CV) was further evaluated in an independent validation cohort. Through this process, we developed a novel, simple Least Absolute Shrinkage and Selection Operator-logistic regression (LASSO-LR) model of variably weighed, standard clinical features that can produce individualised SLE risk probabilities alike clinical diagnostic reasoning. Our model had excellent accuracy for SLE, including early and severe forms of the disease, therefore it could represent a useful clinical tool.
Methods
Discovery and validation cohorts
We used data from the Rheumatology Clinics at the University Hospital of Heraklion and the ‘Attikon’ University Hospital, Athens. Both centres have established SLE registries and use homogenised, structured forms for collecting clinical characteristics (including classification criteria), use of treatments and disease outcomes.11 24–26 We included patients diagnosed during 01/2005-06/2019 with SLE or miscellaneous control rheumatological diseases that are relevant to the differential diagnosis of lupus (online supplemental table S1) by consultant rheumatologists with ≥5 years clinical practice. A randomly selected discovery cohort of 401 patients with SLE and 401 controls ere used to construct, train and compare the ML models. The balanced (1:1) ratio of SLE and controls helps to minimise any predictive modeling biases. An external validation cohort of consecutively registered 512 patients with SLE and 143 controls was used to provide an unbiased estimate of the diagnostic accuracy of the best model. The study was approved by the local ethics committees.
Supplemental material
Variables and data set preparation
For each patient, demographics, rheumatological disease and date of diagnosis, date of earliest reported occurrence of each of the items from the three classification criteria (ACR 1997,27 SLICC 2012,8 EULAR/ACR 20199 10) and date of last follow-up visit/assessment were extracted. Attribution of the criteria items to SLE or not was arbitrated by rheumatologists (DTB, GKB, AF) using the EULAR/ACR attribution rule.9 10 We used criteria items both in their original version and after deconvolution into subitems (eg, ‘maculopapular rash’ subitem from the EULAR/ACR 2019 ‘acute cutaneous lupus’ criterion). In addition, we monitored a predefined list of non-criteria features (online supplemental table S2). Missing data were eliminated through vigorous charts review and quality control.
Disease subsets and outcomes
Early SLE was defined as duration less than 24 months since diagnosis. Lupus nephritis was determined according to kidney histological findings suggestive of lupus in a patient with compatible clinical and/or serological findings. Neuropsychiatric lupus was diagnosed through multidisciplinary approach28 and ascertained by the Italian Study Group attribution model.29 The British Isles Lupus Assessment Group (BILAG) glossary30 was used to classify the severity of manifestations as previously detailed.11 26 Use of immunosuppressive/biologic treatments and the physician global assessment of disease severity were also collected. The date of each item of the SLICC/ACR damage index (SDI)31 was monitored.
Feature selection, model construction and evaluation
We followed two approaches for developing a predictive model for SLE. First, we combined each one of the three classification criteria with additional, non-redundant features from the other two criteria sets and with non-criteria features; second, we developed a de novo model based on clinical variables selected from the three classification criteria and non-criteria features. Univariable LR (online supplemental table S3) was performed in the discovery cohort to determine the association of each individual feature with SLE and correlation analysis (online supplemental table S4) to detect collinearity between features/predictors and assist clinicians in the construction of feature panels. Clinicians (GKB,CA) created 20 panels of features with the aim to introduce alternative feature versions. Each panel was submitted into two ML algorithms for feature selection, namely, RF and LASSO, the latter followed by LR (figure 1). Details are provided in the online supplemental methods.
Supplemental material
Supplemental material

Schematic overview of the methodology for developing a machine learning-based diagnostic model for SLE. We used a discovery cohort of randomly selected 802 adults with SLE or control rheumatologic diseases (1:1 ratio) to prepare 20 clinically selected panels of classification criteria items (both in their original version and deconvoluted into subitems in the case of composite items) and non-criteria features. Two machine learning methods were applied for feature selection and model construction for each panel: (A) Random Forests (RF) and (B) Least Absolute Shrinkage and Selection Operator (LASSO) followed by logistic regression (LASSO-LR). The best model (highest accuracy the in 10-fold cross-validation process) was further tested in an independent dataset of 512 patients with systemic lupus erythematosus (SLE) and 143 disease controls (validation cohort). AUC, area under the curve; CV, cross-validation; ROC, receiver operating curve.
We performed a 10-fold stratified CV) process (division of the dataset into 10 folds of near-equal size without resubstitution) to construct and compare the 40 multivariable models for their predictive capability. Each fold (10%) was used as a test data set to determine the model performance, while the remaining nine folds (90%) were used as the training data set for the model construction. We evaluated the following metrics (averaged from the 10 CV test data sets): sensitivity, specificity, accuracy and area under the receiver operating characteristic curve (AUC-ROC). The model with the highest accuracy was selected as the best to undergo evaluation in the validation cohort.
Statistical analysis
The Kruskal-Wallis analysis of variance was used to compare means and the χ2 test to compare proportions. To convert the LASSO-LR model into scoring system, regression coefficients were divided by the smallest coefficient followed by rounding to the nearest 0.5 value. Statistical analyses were performed using the R software (V.3.5.1) and SPSS (V.25.0). Feature selection and ranking, model construction, evaluation and validation were developed in MATLAB V.9.2.
Results
Combination of the classification criteria with additional features yields modest improvements in diagnostic accuracy for SLE
Classification criteria comprising different collections of clinical and immunological features classify patients with SLE in routine practice with high sensitivity and specificity.11 32–38 We examined whether their combination with additional, non-redundant features can improve their performance. We used a balanced discovery cohort of 802 patients with clinically diagnosed SLE or control diseases to fit two ML algorithms, RF and LASSO-LR (figure 1). Combinatory models of the criteria with additional features showed increased accuracy for SLE (by 0.38%–3.11% in the 10-fold CV runs) over the original versions of the criteria (online supplemental table S5). The greatest improvement was observed for ACR 1997-based models where LASSO feature selection identified alopecia, hypocomplementinemia, maculopapular rash and interstitial lung disease (ILD) as additional predictors for SLE. Modeling the EULAR/ACR 2019 classification score together with antinuclear antibodies (ANA) (treated as additional feature rather than as entry criterion), ILD and livedo reticularis showed enhanced diagnostic performance. These results suggest that certain modifications that could improve—albeit modestly—the accuracy of the classification criteria for SLE.
A de novo-constructed LR model has superior performance for SLE diagnosis
We next sought to develop a novel statistical algorithm by integrating individual items from the classification criteria and additional non-criteria manifestations. Feature selection was performed either embedded in RF or prior to the model construction phase, with LR based on LASSO-LR. An important difference between these two methods is that if several highly correlated variables are predictive, LASSO may select one or a few while RF may use all of them. The best model in the discovery cohort 10-fold CV runs was a LASSO-LR model of 14 clinical parameters (hereafter referred to as ‘SLERPI’: SLE Risk Probability Index) (online supplemental table S5).
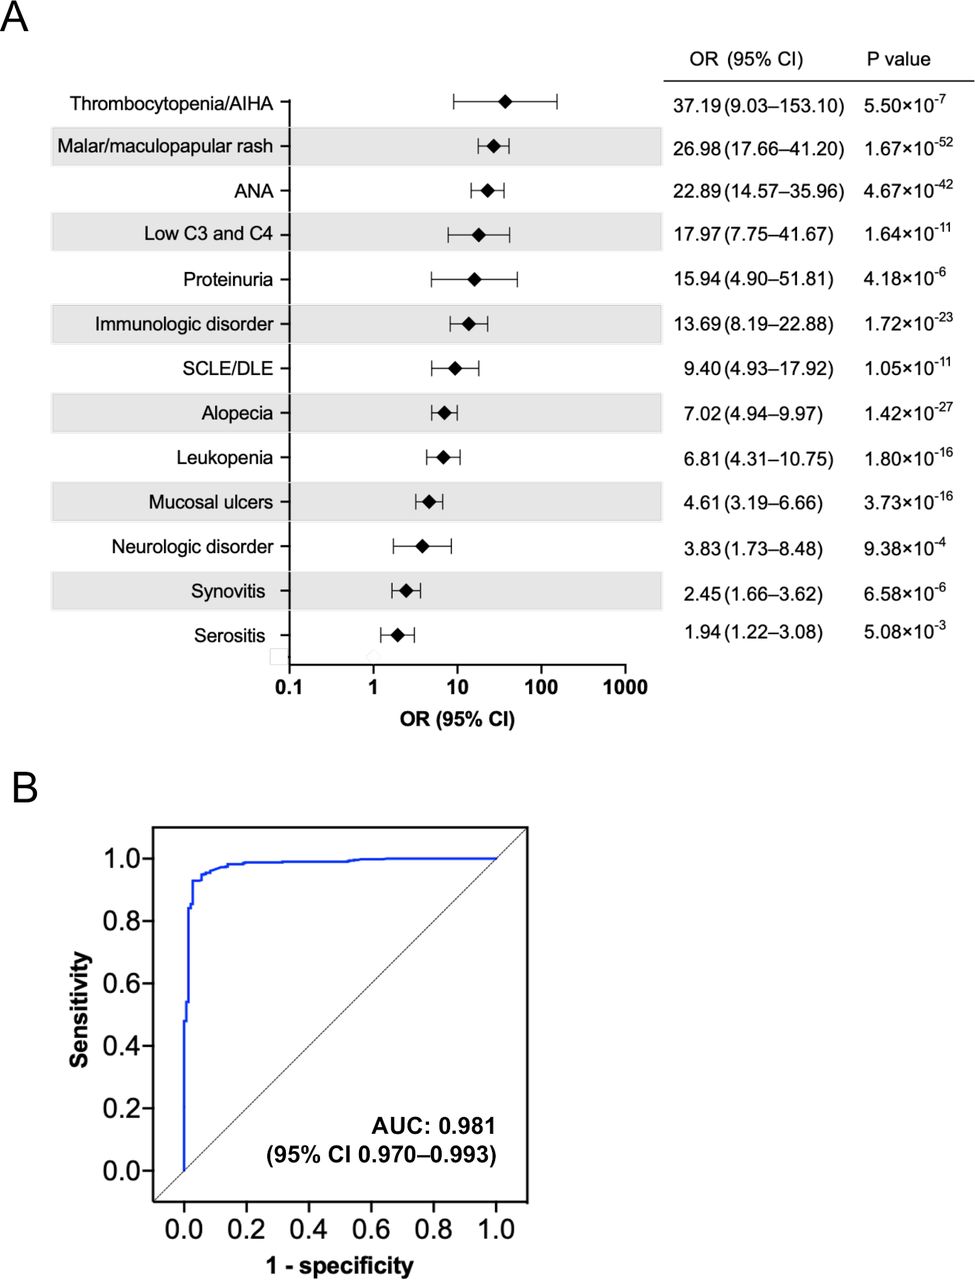
The model parameters included features from all three sets of classification criteria and ILD as a single non-criteria feature. Autoimmune thrombocytopenia or haemolytic anaemia, malar or maculopapular rash, low C3 and C4, proteinuria (all defined according to the EULAR/ACR 2019 criteria), ANA and the ACR 1997 immunological disorder (modified to include anti-β2-glycoprotein antibodies) had the strongest positive association with SLE (figure 2A, online supplemental figure S1). Using a validation cohort of 512 clinically diagnosed patients with SLE and 143 disease controls to confirm our model, we noted excellent ability to discriminate true positive (SLE) versus false positive (control) cases with an area under the ROC curve (AUC) of 0.981 (figure 2B).
Supplemental material

A Least Absolute Shrinkage and Selection Operator-logistic regression (LASSO-LR) model shows high discriminating capacity for SLE against competing rheumatological diseases. (A) A LASSO-LR model comprising of 14 clinical and serological features showed the highest accuracy for SLE in the 10-fold cross-validation runs from the discovery cohort. The plot illustrates the features associated with increased likelihood for SLE as compared with control rheumatological diseases along with the corresponding effect sizes (OR; 95% CI, p value). All model parameters are treated as dichotomous (ie, present=1, absent=0) in the LR equation as follows: F(x)=Intercept + (1.80×mucosal ulcers 1) + (2.96×synovitis1) + (1.83×serositis1) + (3.66×immunologic disorder2) + (4.42×antinuclear antibodies (ANA)3) + (2.13×alopecia4) + (2.17×neurologic disorder4) + (4.25×malar and/or maculopapular rash3) + (2.58×subacute cutaneous lupus erythematosus (SCLE) and/or discoid lupus erythematosus (DLE)3) + (1.82×leucopenia3) + (6.46×thrombocytopenia and/or autoimmune haemolytic anaemia (AIHA)3) + (6.63×low C3 and C43) – (1.45×interstitial lung disease (ILD) 5); 1defined according to the ACR 1997 classification criteria, 2defined according to the ACR 1997 criteria modified to include also positive anti-β2 glycoprotein IgG or IgM antibodies, 3defined according to the EULAR/ACR 2019 classification criteria, 4defined according to the SLICC 2012 classification criteria, 5see online supplemental table S2) for definition. (B) The LASSO-LR model presented in (A) was further evaluated in an external (validation) cohort of patients with 512 patients with SLE and 143 disease controls. The graph represents the receiver operating curve with a calculated area under the curve of 0.981 indicating an excellent capacity of the model to discriminate SLE versus disease controls.
The new LR model enables SLE risk stratification into distinct diagnostic certainty levels
To determine how our model could be used in clinical practice, we applied the LR equation to generate SLE risk probabilities ranging 0%–100%, depending on the combination of features/predictors. We reasoned that different ranges of probabilities correspond to varying diagnostic certainty levels alike clinical thinking. For this, we calculated the SLE risk probabilities for all patients in the discovery cohort followed by unsupervised k-means clustering to detect unbiased risk probabilities partitions. Following merging of the closely related clusters C and D (online supplemental figure S2), we obtained four groups of increasing risk probability bins (0%–14%, 15%–43%, 44%–86%, 87%–100%).
Supplemental material
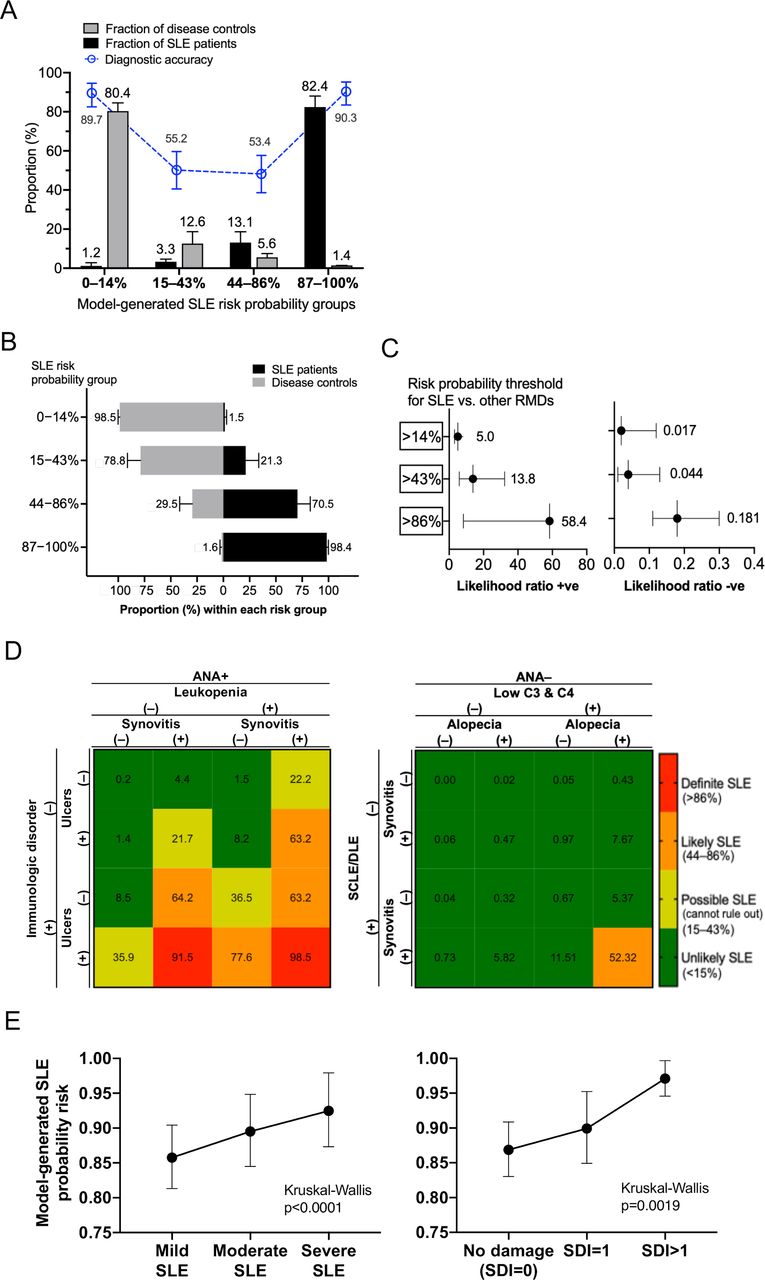
Next, we used the validation cohort to determine the proportion of actual SLE and control patients captured within each predicted SLE risk group (figure 3A). Results were averaged from randomly generated, non-overlapping patient subsets (seven subsets each containing 73 or 74 patients with SLE, two subsets containing 71 and 72 disease controls). We confirmed the high discriminating capacity of our model as the majority of control (80%) and patients with SLE (82%) were in the lowest (0%–14%) and highest (87%–100%) risk groups, respectively. Concordantly, accuracy was highest in the two extreme risk groups but dropped in the intermediate ones. Thus, about 21% and 71% of the validation cohort patients in the 15%–43% and 44%–86% risk groups, respectively, had clinical SLE (figure 3B).

The Least Absolute Shrinkage and Selection Operator-logistic regression (LASSO-LR) model can generate SLE risk probabilities, which correspond to distinct diagnostic certainty levels and correlate with disease outcomes. (A) Bar plot representation of the fraction of patients with SLE patients and disease controls (validation cohort) according to increasing bins of predicted SLE risk probabilities (0%–14%, 15%–43%, 44%–86%, 87%–100%) calculated by the LASSO-LR model shown in figure 2. Superimposed are the diagnostic accuracies (blue-coloured) corresponding to the rates of correct classification of disease controls against patients with SLE in the lower two probability bins (0%–14%, 15%–43%), and of patients with SLE against disease controls in the higher two probability bins (44%–86%, 87%–100%). Results are averages (±SD) for patient fractions or 95% CI for the accuracy metric) calculated from randomly generated, non-overlapping subsets of patients with SLE (seven subsets each containing 73 or 74 patients) and disease controls (two subsets containing 71 and 72 patients) from the validation cohort. The majority of control (average 80%) and SLE (average 82%) patients belong to the lowest (0%–14%) and the highest (87%–100%) risk probability groups, respectively. In accordance, accuracy was highest in these two extreme risk groups but dropped in the intermediate ones (15%–43%, 44%–86%). (B) Bar plot representation of the relative proportion of SLE and disease controls (validation cohort) within each SLE risk probability bin (0%–14%, 15%–43%, 44%–86%, 87%–100%). Calculations were made from the non-overlapping subsets of patients with SLE and disease controls as outlined in (A). (C) Positive- and negative-likelihood ratios (LRs) (mean, 95% CI) for the diagnosis of SLE against control diagnoses, according to different SLE risk probability thresholds (>14%,>43%,>86%) applied to the discovery cohort. Calculations were made from the non-overlapping subsets of patients with SLE and disease controls as outlined in (A). The >14% threshold had an average LR+5.0 and LR–0.017, which correspond to a moderate increase when tested positive and a large decrease when tested negative in the likelihood for SLE, respectively. (D) Matrices of SLE risk probabilities based on different combinations of features included in the LASSO-LR diagnostic model. In each scenario, the calculated probability fits to one of the four SLE risk groups corresponding to varying diagnostic certainty levels (unlikely SLE: 0%–14%, possible/cannot rule out SLE: 15%–43%, likely SLE: 44%–86%, definite SLE: 87%–100%). (E) Dot plot analysis of the model-generated SLE risk probabilities according to the severity of disease manifestations (defined based on the BILAG system) and organ damage (SLICC/ACR Damage Index (SDI)). Data were generated from the validation cohort patients with SLE (n=512) and are presented as mean (95% CI). The Kruskal-Wallis (non-parametric) analysis of variance test was performed and two-tailed p values are shown. ANA, antinuclear antibodies; RMDs, rheumatic diseases; SCLE, subacute cutaneous lupus erythematosus; SDI, SLICC/ACRdamage index; SLE, systemic lupus erythematosus.
Using the upper limit probabilities of the risk groups as diagnostic thresholds (>14%, >43%, >86%), the average positive likelihood ratios (LR) for SLE were 5.0, 13.8 and 58.4, respectively, corresponding to moderate, large and very large increases in the likelihood of SLE (figure 3C). The >14% threshold had a negative LR 0.017, suggesting it can be used to exclude SLE against competing diseases with relatively high certainty. Taken together, we can assign the groups ‘definitive SLE’, ‘likely SLE’, ‘possible/cannot rule out SLE’ and ‘unlikely SLE’ to our model probability bins 87%–100%, 44%–86%, 15%–43% and 0%–14%, respectively. To put these data into clinical context, figure 3D illustrates matrices of predicted SLE risk probabilities based on combinations of various features.
Next, we examined the criterion validity of our model by determining its predictive ability against disease-relevant outcomes in the validation SLE cohort. Patients’ risk probabilities correlated positively with increasing disease severity (p<0.0001) and organ damage (p=0.0019) (figure 3E), reflecting increased disease burden. Likewise, patients with SLE with low predicted risk probabilities (0%–14%, 15%–43%) had milder forms of the disease due to lower prevalence of British Isles Lupus Assessment Group (BILAG) A manifestations and organ damage (online supplemental figure S3A-B).
Supplemental material
The SLERPI has high accuracy for detecting SLE including patients with early disease and severe disease requiring potent treatment
In addition to continuous risk prediction, binary outcome models (disease of interest is present or absent) are most helpful in decision-making. We used the discovery cohort for the unbiased definition of the model probability cut-off to separate SLE versus other rheumatological diseases. Based on the maximal Youden’s statistics, the 50% risk probability threshold was chosen (online supplemental figure S4A-C). At this threshold, the SLERPI demonstrated high sensitivity (95.1%), specificity (93.7%) and accuracy (94.8%, corrected to 93.9% based on an expected 3:17 ratio of SLE: controls in real-life setting) in the total validation cohort (figure 4A, (online supplemental figure S5Α). When tested against the control subset with undifferentiated connective tissue disease (n=56), the model specificity was 91.1%. We further determined the model discriminative ability in disease subsets of clinical relevance such as early SLE, lupus nephritis, neuropsychiatric SLE(NPSLE) and severe disease necessitating potent immunosuppressive or biological treatment. The model yielded very high rates of correct predictions within the aforementioned patient groups (figure 4B, online supplemental figure S5B).
Supplemental material
Supplemental material

The new diagnostic model has high accuracy for systemic lupus erythematosus (SLE) including early and severe disease requiring immunosuppressive or biologic treatment. (A) Confusion matrix of the actual versus predicted cases of patients with SLE (n=512) and disease controls (n=143) in the validation cohort. The LASSO-LR diagnostic model was operated as binary (SLE or not-SLE) by setting the SLE risk probability threshold at ≥50%. Based on the number of true-positive, true-negative, false-positive and false-negative cases, sensitivity, specificity, accuracy, positive- and negative-likelihood ratios are estimated as metrics of the model diagnostic performance. (B) Sensitivity of the LASSO-LR model (operated as binary) for the detection of clinically relevant subsets of SLE including early disease, lupus nephritis, neuropsychiatric lupus, haematological lupus and severe lupus requiring potent immunosuppressive and/or biologic treatment.
Finally, to facilitate its implementation in daily practice, we converted our model into a simple scoring system (table 1). The scoring system-generated SLE probabilities showed high correlation with the risk probabilities produced by the original LR model (r2 0.996) in the validation cohort. When operated at a threshold of >7 (out of maximum score 30.5), the sensitivity, specificity and accuracy were estimated at 94.2%, 94.4% and 94.2%, respectively, suggesting comparable performance with the original model.
A simple scoring system version of the SLE Risk Probability Index*
Discussion
Herein, we have developed and validated a simple, clinically applicable model to assist SLE diagnosis through ML training of well-characterised data from two large discovery and validation patient cohorts. Our model comprising 14 classical, variably weighted features, enables continuous risk prediction for clinical SLE, thus resembling clinical reasoning, while attaining a combination of high sensitivity and specificity against alternative rheumatologic diseases. When used as a dichotomous algorithm (SLE-or-not), the SLERPI exhibits high accuracy for SLE, including early and severe/organ-threatening disease forms.
In clinical practice, physicians can elicit the diagnosis of SLE even in the presence of a few high-yield manifestations such as typical malar rash in an individual with anti-DNA autoantibodies.1 39 Such decisions reflect a form of human intelligence that develops through clinical experience even with a limited number of patients. Conversely, computational intelligence tools require training on large comprehensive data sets to produce valid results.14 We used a discovery sample of well-characterised SLE and control patients for unbiased selection of features that contribute most to clinical SLE diagnosis. Patients with SLE with relatively early disease (median duration 4.2 years) and irrespective of the severity of manifestations were included, as compared with developing classification criteria, which typically rely on cases with long-standing disease.
Thrombocytopenia/autoimmune haemolytic anaemia (AIHA), malar rash, proteinuria, ANA, immunological disorder (anti-DNA, anti-Sm, anti-phospholipid antibodies) and combined C3 and C4 hypocomplementemia were the strongest predictors against competing rheumatological diseases. These results are in line with the variably weighted items introduced in the EULAR/ACR 2019 classification criteria, where, for example, thrombocytopenia/AIHA is scored higher than leucopenia and malar rash higher than other rashes.9 10 40
SLE displays marked phenotypic heterogeneity ranging from systemic to organ-limited/dominant forms. Clinical and immunological features may accrue sequentially in time, thus reflecting an evolving process.41 42 Indeed, various terms have been used to describe different patient profiles such as ‘definitive SLE’, ‘probable SLE’, ‘possible SLE’, ‘lupus-like’ or ‘incomplete lupus’. Our model calculates risk probabilities, which correlate with certainty levels for the presence of SLE versus competing rheumatological diseases. Based on unsupervised clustering, we hereby propose a risk probability-based stratification of patients with suspected SLE into ‘unlikely’, ‘possible’ (cannot rule out), ‘likely’ and ‘definitive’ SLE, depending on the type and number of features. This approach resembles diagnostic reasoning especially when encountering a patient for the first time.43 44 Our model can be used not only to exclude (when risk probability is <14%) or confirm (when risk probability exceeds 86%) SLE but also to alert physicians to identify and monitor patients with intermediate probabilities. Similar approaches have been used in other complex diseases.45
By operating our model as binary, we achieved very high rates of sensitivity, specificity and accuracy assessed in a validation cohort. Our model can identify SLE under different clinical scenarios such as: (a) lupus autoantibodies concurring with a single clinical feature from a major organ (eg, thrombocytopenia/AIHA), (b) multiple clinical but no immunological features, (c) limited or non-specific serological features (eg, ANA) concurring with high-yield clinical manifestations (eg, malar rash). We noted excellent performance within patient subgroups with early disease, biopsy-proven lupus nephritis, neuropsychiatric disease and severe disease necessitating potent immunosuppressive or biologic therapies.
ML-based tools are increasingly used to simulate human ‘medical reasoning’ and effectively handle complex tasks. Such models can be trained from many different kinds of medical or biological data. Our data sets included well-defined features derived from the three classification criteria, and also non-criteria features often considered by physicians in cases of suspected SLE. ILD was a feature alienating the probability of SLE while favouring alternative rheumatological disease. Integration of additional clinical, laboratory or biological (eg, transcriptome) variables could lead to the development of even more robust models.46 47 The fact that our model comprises 14 classical, easily retrieved clinical variables facilitates its clinical implementation.
Additional studies should prospectively evaluate and independently validate the proposed model to establish its clinical utility and effect on a variety of patient and healthcare outcomes. Notwithstanding, our analysis might provide useful insights towards the possible future development of formal SLE diagnostic criteria, a currently unmet need.39 To this end, establishing a firm diagnosis and treatment plan still remains at the judgement of experienced physicians.
Our study is limited by its retrospective design and data extraction from medical records; accordingly, some clinical information may have been missed or underestimated. Nonetheless, both centres maintain detailed patient registries and use structured forms for collecting clinical data, which helps to reduce possible information/data completeness bias. Developing a model for early diagnosis should ideally be based on cohorts with very early disease and before the appearance of adverse outcomes, however, it can be challenging to recruit large numbers of such cases.3 48 Although we used two state-of-the art ML approaches, a number of other sophisticated algorithms of higher complexity exist (eg, deep neural networks49). Our model also requires validation in additional cohorts of diverse population characteristics (eg, non-Caucasians), including infectious disease controls.
Conclusively, we have developed and evaluated a new, simple and interpretable model for the detection of SLE based on common clinical and serological features. Our model provides risk predictions that correlate with clinical endpoints and support patient probabilistic disease classification of potential clinical relevance. Pending further confirmation of its performance, the SLERPI could assist the early diagnosis and treatment of SLE, including early and severe forms, to improve patient outcomes.
Data availability statement
Data are available upon reasonable request. Data will be available upon request.
Ethics statements
Patient consent for publication
Ethics approval
The study was approved by the Ethics Committee of the University Hospital of Heraklion (protocol number 13960/10-10-2018) and the Ethics Committee of the ‘Attikon’ University Hospital of Athens.
Acknowledgments
We are thankful to the staff physicians and nurses of the Rheumatology Clinics of the University Hospital of Heraklion and 'Attikon' University Hospital of Athens for providing care to the patients with SLE and other rheumatologic diseases.
References
Supplementary materials
Supplementary Data
This web only file has been produced by the BMJ Publishing Group from an electronic file supplied by the author(s) and has not been edited for content.
Footnotes
Handling editor Josef S Smolen
Twitter @none, @george_bertsias
CA and IG contributed equally.
Correction notice This article has been corrected since it published Online First. The provenance and peer review statement has been included.
Contributors CA, DN and MN collected data from patient medical charts and also performed data entry. IG designed and implemented the machine learning (ML) methodology, constructed and evaluated the ML models and drafted the relevant methodology sections on feature selection, model construction, evaluation and statistical analysis. AB organised the RedCap database. AR and AF assessed patients enrolled in the study and collected data from patient medical charts. PS and DTB assisted in patient recruitment and critically reviewed the manuscript. GKB conceived and supervised the study, performed statistical analyses and drafted the manuscript.
Funding The study received funding by the Hellenic Society of Rheumatology & Professionals Union of Rheumatologists of Greece (protocol number: 644), the Pancretan Health Association and the Foundation for Research in Rheumatology (FOREUM; protocol number: 016BertsiasPrecl) and from the European Research Council (ERC) under the European Union’s Horizon 2020 Research and Innovation programme (grant agreement number 742390) to DB.
Competing interests None declared.
Provenance and peer review Not commissioned; externally peer reviewed.
Supplemental material This content has been supplied by the author(s). It has not been vetted by BMJ Publishing Group Limited (BMJ) and may not have been peer-reviewed. Any opinions or recommendations discussed are solely those of the author(s) and are not endorsed by BMJ. BMJ disclaims all liability and responsibility arising from any reliance placed on the content. Where the content includes any translated material, BMJ does not warrant the accuracy and reliability of the translations (including but not limited to local regulations, clinical guidelines, terminology, drug names and drug dosages), and is not responsible for any error and/or omissions arising from translation and adaptation or otherwise.